- | Government Spending Government Spending
- | Data Visualizations Data Visualizations
- |
2014 Trustees’ Reports: Long-Term Medicare Program Cost Projections
This chart series includes updated versions of previous Mercatus Center charts presenting the long-term projections for Medicare programs. The first chart compares total Medicare cost projections under a current law assumption with two alternative projections under more realistic baseline assumptions, measured as a percentage of the economy.

The recently released 2014 Social Security and Medicare Trustees’ Reports, which project rising long-term costs under a number of assumed scenarios, should prompt a serious examination of the trust funds’ financial status.

This chart series includes updated versions of previous Mercatus Center charts presenting the long-term projections for Medicare programs. The first chart compares total Medicare cost projections under a current law assumption with two alternative projections under more realistic baseline assumptions, measured as a percentage of the economy. The second, third, and fourth charts compare cost projections under these various assumptions for Medicare Part B, Medicare Hospital Insurance (HI), and Medicare Part D expenditures, respectively.
The charts display the long-term projections for all Medicare costs using current law assumptions along with two supplemental projections—called “projected baseline” and “alternative to baseline”—that incorporate alternative assumptions. The “projected baseline” scenario assumes a continuation of the historical pattern of sustainable growth rate (SGR) overrides, that is, the formula that establishes physician fee schedule payments under Medicare Parts B and D. The “alternative to baseline” scenario additionally assumes that certain controversial elements of the 2010 Affordable Care Act (ACA) are either scaled back during the period from 2020 to 2034 or eliminated altogether.
These labels reflect a key change in this year’s report. The projected baseline and alternative baseline projections were called “first alternative” and “full alternative” scenarios in previous reports. This change demonstrates that the Trustees recognize that the current law projections likely understate expected costs and are emphasizing the projected baseline projections as more realistic.
As the first chart shows, Medicare cost projections vary considerably in the long run, depending on the assumptions. A difference of one percentage point of GDP between calculations can yield enormous divergences in realized costs. For example, if the assumptions of the alternative baseline prove correct, then Medicare expenditures in 2080 could be about 45 percent greater than projected under current law. The chart shows that current law projections predict Medicare costs will be 6.26 percent of GDP in 2080. Under the projected baseline, total costs will be 6.78 percent of GDP in 2080. In the alternative to the baseline, total Medicare costs climb to 8.09 percent of GDP by 2080. In other words, total projected Medicare costs are on track to rise faster than GDP. If lawmakers continue to override the physician payment formula and decline to cut physician reimbursement, total Medicare costs will be substantially higher than projected in the long run under current law.
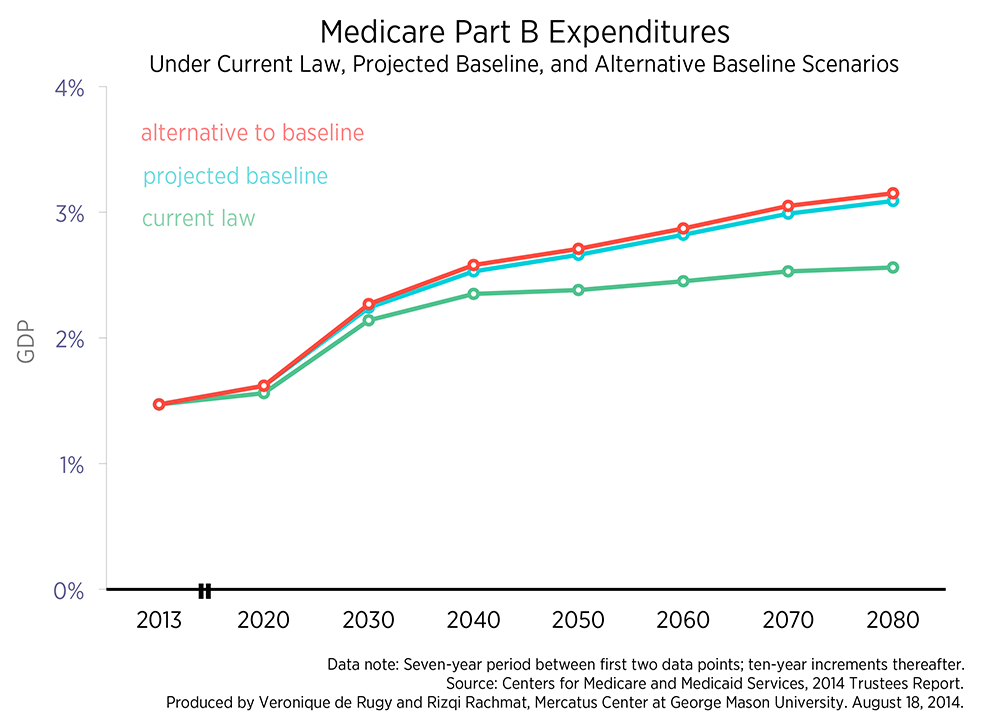
The second chart limits the same analysis to the Medicare Part B program. Under current law, Part B spending is projected to increase from 1.47 percent of GDP in 2013 to 1.56 percent by 2020 and 2.56 percent of GDP by 2080. For the projected baseline, Part B almost doubles as a share of GDP between 2020 and 2080, growing from 1.62 percent of GDP in 2020 to 3.09 percent of GDP by 2080. In alternative baseline scenario, Part B is expected to reach 3.16 percent of GDP by 2080.
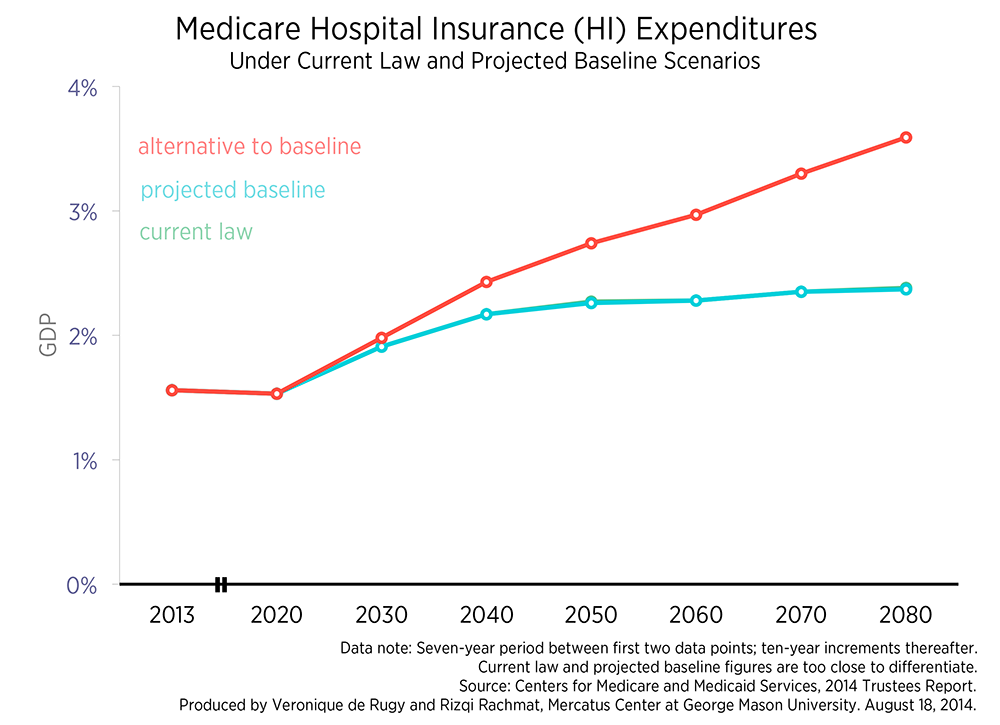
The third chart displays cost projections for Medicare Hospital Insurance (HI). Under current law, HI costs are projected to increase from 1.56 percent of GDP in 2013 to 2.38 percent in 2080. The projected baseline just barely differs from the current law projection, predicting HI costs equal to 2.37 percent of GDP in 2080. This is because the only difference between the current law and baseline projections is the SGR override, which only affect the programs that draw from the Supplementary Medicare Insurance (SMI) trust fund. Since HI does not draw from this fund, there is little difference between the current law and baseline projections. The alternative to the baseline projects HI costs to exceed 3.5 percent of GDP by 2080.
The Medicare Hospital Insurance trust fund is now expected to run out of assets in 2030—that’s four years later than projected last year. This is nothing to celebrate—it’s not clear that these projections will materialize because the Trustees report that “the fund is not adequately financed over the next 10 years.” The HI trust fund, like the Social Security trust fund, determines the spending authority of the programs. Without an adequate trust fund balance, payouts will be limited to what the program collects by itself (Medicare HI also gets some income from premiums and from payments by states), which will result in sharp curtailment of payments.
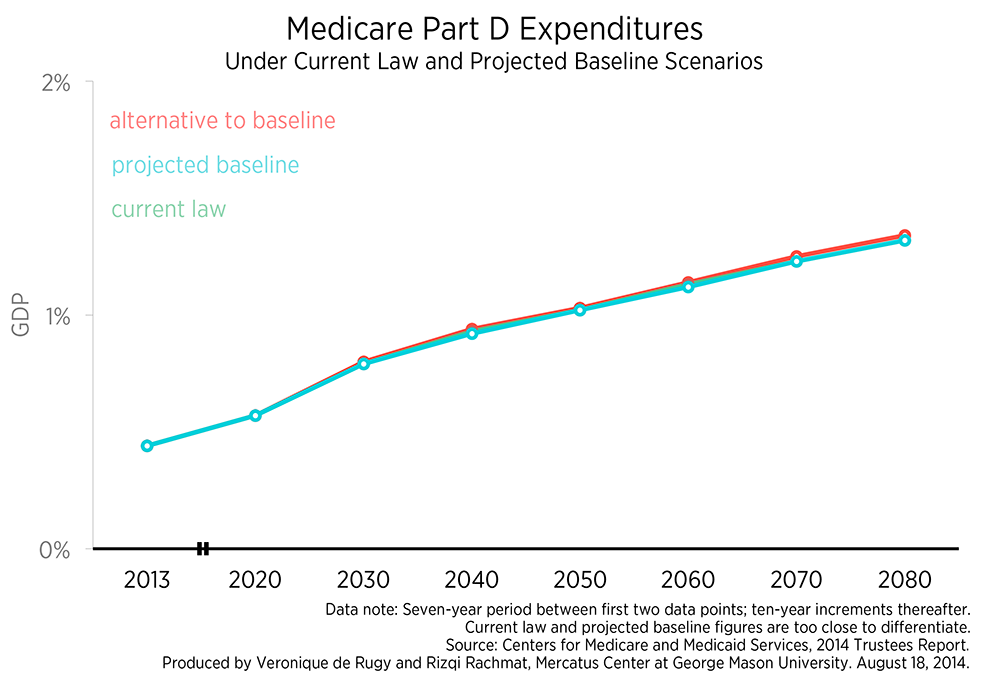
The last chart displays cost projections for Medicare Part D expenditures. Compared to other programs, there appears to be very little difference between the various scenarios for Part D expenditures. This can be explained by the legislatively mandated solvency inherent in the design of Part D. As Mercatus fellow and Trustee Charles Blahous explains, “Payments for physician services (Part B) as well as prescription drugs (Part D) are made from Medicare’s Supplementary Medical Insurance (SMI) trust fund ($317 billion spent in 2013). SMI is kept solvent by statutory design; only about one-quarter of its revenues are provided by beneficiary premiums, the other three-quarters provided from the government’s general fund in whatever amounts are necessary to finance benefits.”
As we’ve seen before, even these grim numbers might be too optimistic because some of the expected revenue or cost savings in the current law may never materialize. In fact, a section in an appendix of the 2014 Trustees’ Report, called “Statement of Actuarial Opinion,” makes that point very clearly. (p. 276) For instance, Paul Spitalnic, the acting chief actuary of the program, explains that “current law would require a physician fee reduction of an estimated 21 percent on January 1, 2015—an implausible expectation.”
The report projects dwindling trust funds, greater enrollment, higher costs per beneficiary, and insufficient revenues to fund future payouts. These charts show that a slight change in economic assumptions in the present can yield dramatic effects in the long run that further undermine program solvency. These programs are in dire need of fundamental reform, and time is running out.
Related Content
- | Government Spending Government Spending
- | Data Visualizations Data Visualizations
CBO Updates Budget and Economic Outlook: 2014 to 2024

- | Government Spending Government Spending
- | Data Visualizations Data Visualizations
Update: Social Security Remains on an Unsustainable Path

- | Government Spending Government Spending
- | Expert Commentary Expert Commentary
A Guide to the 2014 Medicare Trustees Report
- | Government Spending Government Spending
- | Expert Commentary Expert Commentary