- | Government Spending Government Spending
- | Data Visualizations Data Visualizations
- |
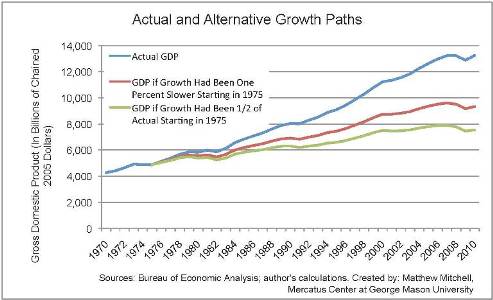
Actual and Alternative Growth Paths for the United States
This chart illustrates the impact of slower growth by imagining what our economy would look like if, starting in 1975, we had accumulated the sort of debt that we are about to accumulate.
According to the Congressional Budget Office’s Alternative Fiscal Scenario, the U.S. public debt-to-GDP ratio will reach 90 percent within 7 years and 100 percent by 2021. Ours is not the first nation to accumulate debt levels of this magnitude. In their examination of 200 years’ worth of data from over 40 countries, economists Carmen Reinhart and Kenneth Rogoff found that when nations’ debt levels rise above 90 percent of GDP, their growth rates slow. In some situations, real growth slowed by 1 percentage point; in others, it was cut in half.
In this week’s chart, Mercatus Center Research Fellow Matthew Mitchell illustrates the impact of slower growth by imagining what our economy would look like if—starting in 1975—we had accumulated the sort of debt that we are about to accumulate. The graph shows the path of actual (inflation-adjusted) GDP, along with two hypothetical GDP paths: one in which the nation had grown 1 percentage point slower, and one in which it had grow at half of its actual pace. The impact is striking. After 35 years of 1 percentage-point slower growth, the U.S. economy would now be about 30 percent smaller than it actually is; after 30 years of half our actual growth rate, the economy would be little more than half of its actual size.
Many believe that because the U.S. operates the world’s reserve currency, it is unique and can experience debt ratios in excess of 90 percent without the sort of slowdown seen in other countries. This may be true, but under current forecasts, our debt will not stop accumulating. Within a few decades, the debt-to-GDP ratio will be nearly 200 percent—with no sign of stopping. There is clearly some future point at which the U.S. economy will begin to slow.