- | Government Spending Government Spending
- | Data Visualizations Data Visualizations
- |
Debt and Deficits in CBO’s Updated Budget Outlook: 2014 to 2024
This week’s charts use data from the Congressional Budget Office’s (CBO) recently released update to its Budget and Economic Outlook to show the trends and components of projected debt and deficit increases. The charts show that debt and deficits will continue to grow over the coming decade, although enacting certain policy changes—such as freezing most discretionary spending at current levels or extending expiring tax cuts—could over the next decade shrink deficits by $615 billion or add $897 billion to baseline deficit projections, respectively.
This week’s charts use data from the Congressional Budget Office’s (CBO) recently released update to its Budget and Economic Outlook to show the trends and components of projected debt and deficit increases. The charts show that debt and deficits will continue to grow over the coming decade, although enacting certain policy changes—such as freezing most discretionary spending at current levels or extending expiring tax cuts—could over the next decade shrink deficits by $615 billion or add $897 billion to baseline deficit projections, respectively.
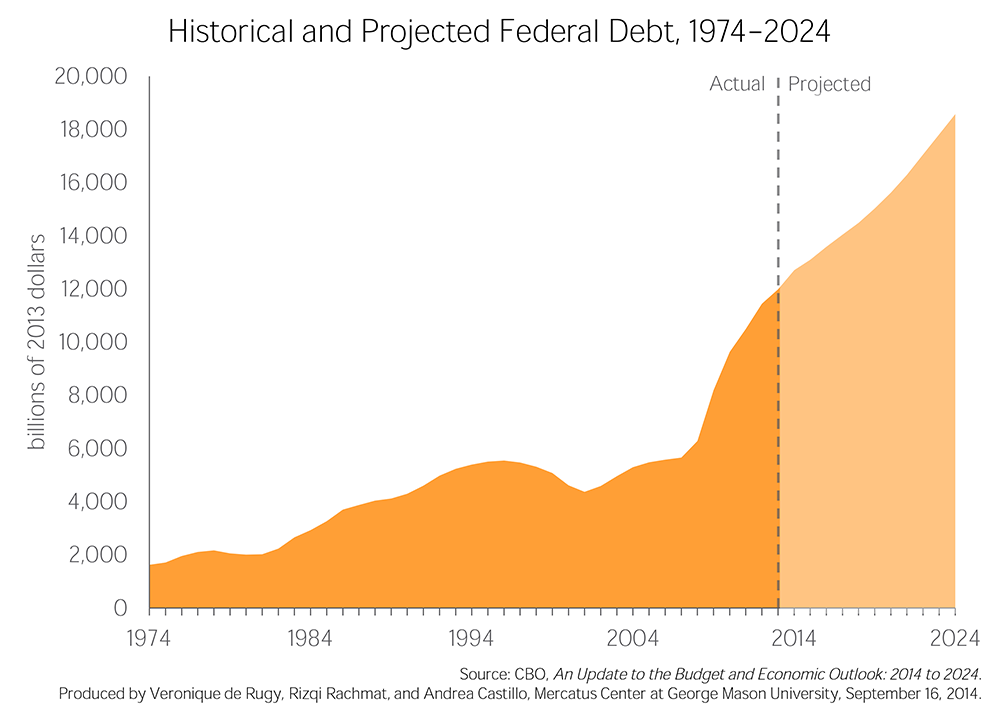
The first and second charts display historical and projected trends in baseline federal debt held by the public and deficits, respectively, in real 2013 dollars. The third chart displays the cumulative fiscal effects of various policy changes that, if enacted, could increase or decrease projected deficits over the coming decade.
The first chart shows the unprecedented growth in federal debt projected by CBO over the next decade. Our current debt level of $11.9 trillion is expected to reach $12.7 trillion by the end of 2014, after which debt will grow by an average annual rate of 4 percent. CBO projects that debt will exceed $18.6 trillion by 2024, which translates to a 46-percent increase in the debt in just a decade. If these projections come to pass, then federal debt will have grown by an astounding 1044 percent since the relatively modest $1.6 trillion debt level of 1974.
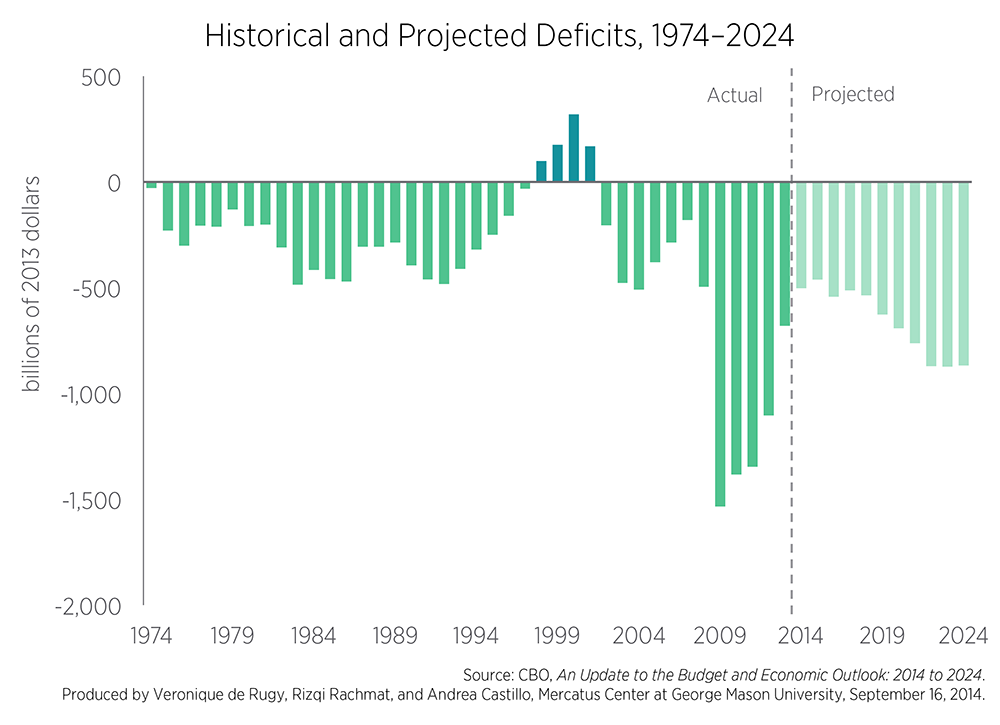
The second chart displays the actual and projected deficits or surpluses that influence the debt levels displayed in the first chart. The decline in deficits that began in 2010 is expected to continue for the next two years, but CBO projects that deficits will grow by an average annual rate of 3 percent over the next decade, increasing from $502.4 billion in 2014 to $867.5 billion by 2024. While deficits are projected to decrease slightly in 2017 and 2024, they increase overall by 73 percent by the end of the decade. However, CBO’s deficit projections could differ from actual deficits if certain policy alternatives take effect.
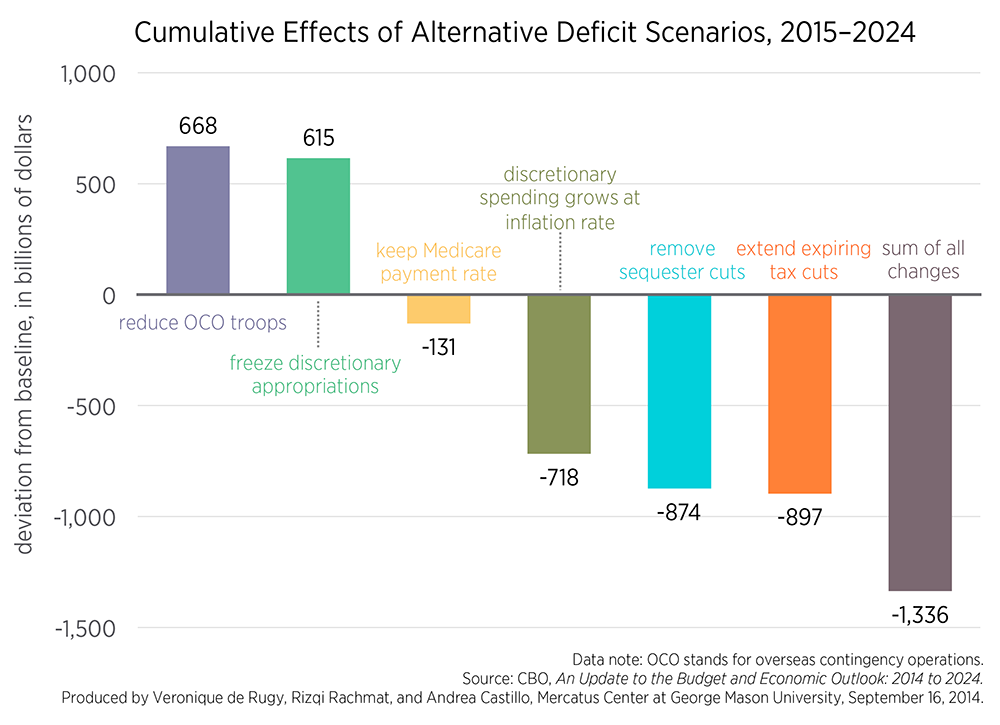
The third chart displays how the cumulative fiscal effects of each policy from 2015 to 2024 deviates from CBO’s baseline, along with the sum of all changes. In some cases, policy changes could improve the deficit picture. For example, if Congress decides to freeze discretionary spending for 2015 through 2024 at the nominal 2014 level, then CBO projects that cumulative deficits from 2015 to 2024 will be $615 billion less than the baseline scenario.
Other policy changes could add to projected deficits and worsen the fiscal outlook. Maintaining the current Medicare payment rates for physicians would yield a cumulative deficit that exceeds the baseline by $131 billion. If Congress decided to extend expiring tax cuts or remove expected sequester cuts, then actual deficits would cumulatively exceed baseline deficits by $874 billion and $897 billion, respectively.
The high debt levels that CBO projects will be a significant barrier to economic growth if not addressed. Policy changes that focus on improving the debt and deficit picture will therefore improve the United States’ prospects for economic growth as well.

