- | Government Spending Government Spending
- | Data Visualizations Data Visualizations
- |
Defense Spending Excluding War Funding
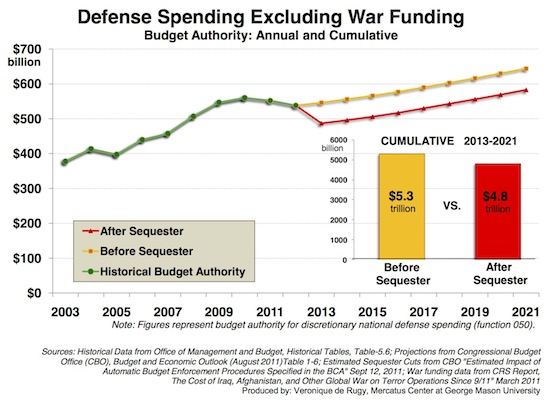
This chart looks at the impact of sequester cuts on defense spending.

This chart by Mercatus Center Senior Research Fellow Veronique de Rugy looks at the impact of sequester cuts on defense spending. Clarifying these figures reveals that sequester cuts do not warrant the fears connected to the failure of the Joint Select Committee to agree on $1.2 trillion in deficit reduction.
Defense budget authorities from 2003 through 2021 are compared using data from the Office of Management and Budget, Department of Defense, Congressional Budget Office (CBO) August 2011 Budget and Economic Outlook, and the Budget Control Act of 2011.
The budget authorities projected below (yellow and red lines) exclude past and future funding for military operations in Afghanistan, Iraq, or elsewhere. The yellow line represents projected national defense budget authority without sequester cuts, and the red line represents this metric incorporating the sequester cuts. Leaving inflation aside, military spending will grow by about 10 percent as opposed to the 18 percent without the cuts. Adjusting for inflation, sequester cuts would bring the military’s purchasing power to 2007 levels—a year when no one was complaining of devastatingly low levels of spending.
Note that this chart shows defense budget authority, or departments’ and agencies’ legal authority to spend. This metric is distinct from budget outlays, which represent actual spending amounts. Importantly, if history is any indication, national defense outlays will be higher (in budgets both with and without sequester cuts) than the budget authorities represented in this chart. According to the CBO, total defense outlays between 2012 and 2021 will grow by 16 percent after the cuts, compared with 23 percent before them. If you exclude funding for the wars in Iraq and Afghanistan, there is 16 percent (versus 26 percent) growth in spending over the period.
It is important to note that simply comparing the yellow and red lines overstates the impact of sequestration—this comparison implies that if the supercommittee had managed to reach a deficit reduction package, this package would have left national defense spending untouched. However, the likelihood that defense spending would have been untouched in any compromise package is extremely small.
Assuming that lawmakers do not use budget gimmicks and the emergency spending process to prop up the defense budget, it is correct to say that sequester cuts will restrain military ambitions. Excluding war spending, and excluding all cuts that the supercommittee may have come up with as part of its reduction package, national defense spending was scheduled to total $5.3 trillion (yellow bar) over the 2013-2021 period. After the cuts, spending is projected to be $500 billion less, totaling $4.8 trillion (red bar). Based on the CBO alternative scenario, a minimum of $381 billion in war spending is likely to be added to the latter amount between 2013 and 2021.
Of course, $4.8 trillion is still a significant amount of money. But an important point is often lost in the debate: in spite of an initial reduction in 2013, nominal national defense spending will continue to grow (see chart).
What’s more, adjusted for inflation, defense spending will remain mostly flat. According to Todd Harrison of the Center for Strategic and Budgetary Assessments, after a cut in spending between 2012 and 2013, national defense will “grow by slightly more than the rate of inflation for the rest of the decade.”


