- | Government Spending Government Spending
- | Data Visualizations Data Visualizations
- |
Disability Insurance Trust Fund Nears Insolvency
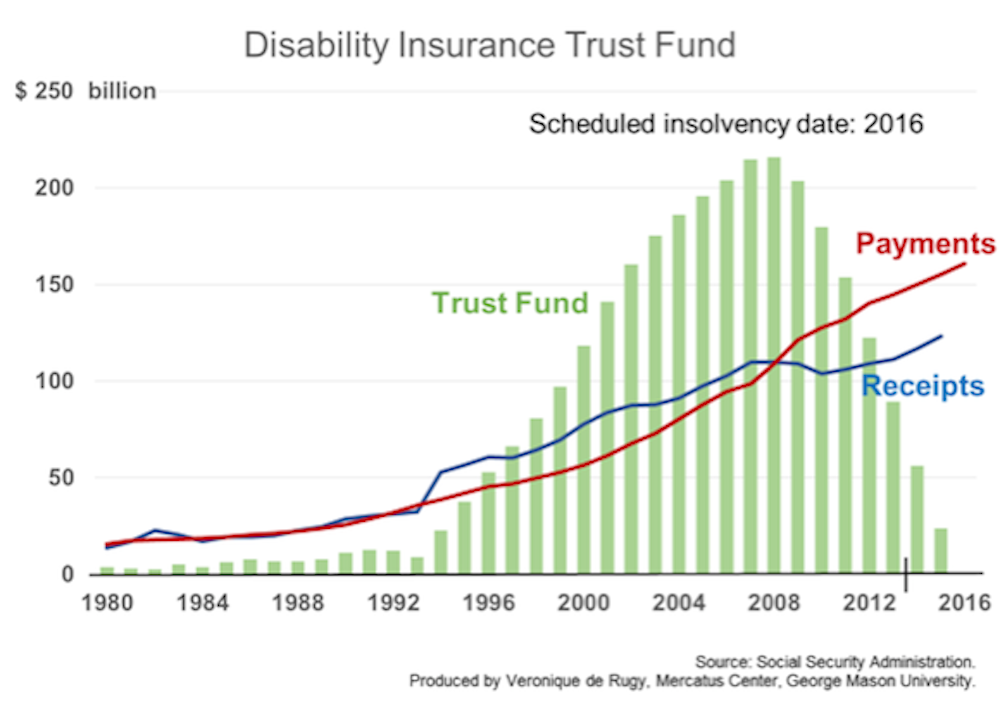
This week’s charts show total receipts, expenditures, and assets left in the Social Security Disability Insurance (DI) trust fund. Data from the 2013 Trustees Report show that the disability fund is currently predicted to be three years from insolvency. Under more pessimistic assumptions, the insolvency date is pushed up to 2015. The fact that the DI trust fund is not currently depleted shouldn’t mislead us into thinking we have until 2016 to deal with the shortfalls.

This week’s charts show total receipts, expenditures, and assets left in the Social Security Disability Insurance (DI) trust fund. Data from the 2013 Trustees Report show that the disability fund is currently predicted to be three years from insolvency. Under more pessimistic assumptions, the insolvency date is pushed up to 2015. The fact that the DI trust fund is not currently depleted shouldn’t mislead us into thinking we have until 2016 to deal with the shortfalls.
Spending on Social Security has more than doubled in the past decade, and DI now accounts for almost 20 percent of Social Security’s budget, up from 10 percent in 1988. The trust fund has been operating under deficits since 2008, as shown by the decline in the trust fund (green bars) and ever-growing gap between the payments (red line) and receipts (blue line). Despite these trends, disability insurance programs are often left out of the social safety net discussion.
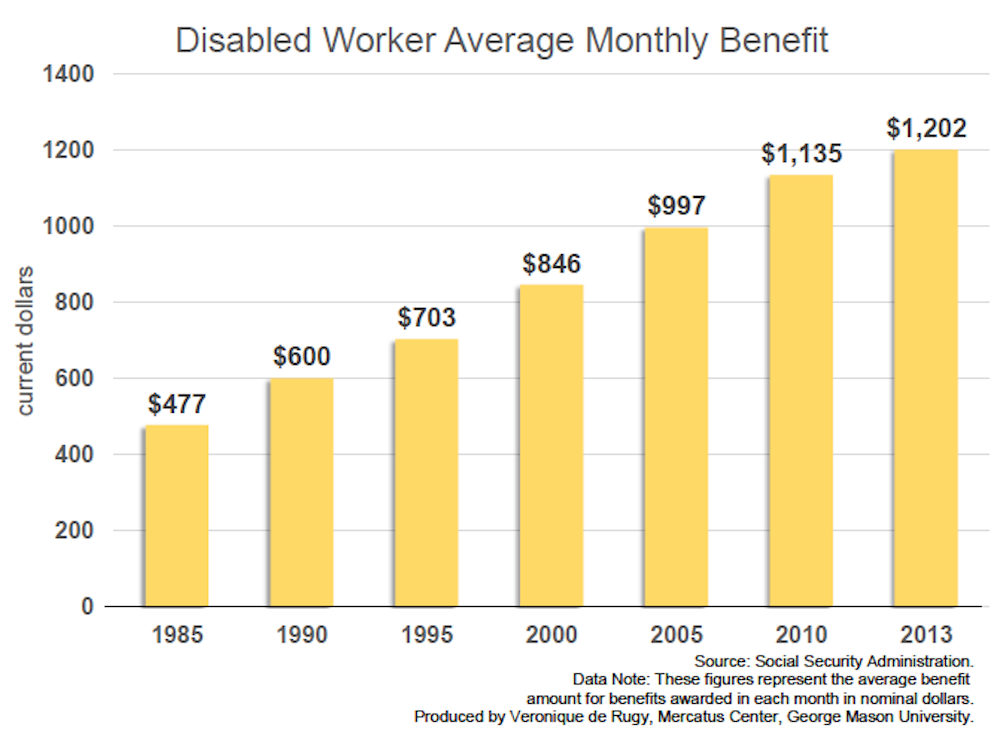
The second chart shows the average monthly benefit workers receive. About 14 million Americans receive a disability check from the government every month. The average monthly payment to a disability beneficiary was $1,202 in July—a number that has more than doubled since 1985. While benefit payments won’t necessarily be stopped if the trust fund runs dry, they will certainly have to be cut by 20 to 30 percent.
As a result, disabled Americans are waiting longer and longer before receiving the benefits they are entitled to. Many now wait as long as two years before having their applications finalized. This situation must change; it’s untenable for both those who rely on the program and those who pay for it.
The figures in chart 2 represent the average benefit amount for benefits awarded in each month in current dollars.
Related Content
- | Government Spending Government Spending
- | Working Papers Working Papers
Saving Social Security Disability Insurance: Reforms within the Context of Holistic Social Security Reform
- | Government Spending Government Spending
- | Expert Commentary Expert Commentary
Social Security Disability Insurance Costs are Exploding

- | Government Spending Government Spending
- | Data Visualizations Data Visualizations
More Americans Dependent on Disability, Longer
