- | Government Spending Government Spending
- | Data Visualizations Data Visualizations
- |
The Elusive Recovery
Once the recession ended, we should have seen economic growth continue to accelerate after the 2.4 percent growth in 2010. Instead, economic output has been more sluggish after each year since 2010. These charts, using data from the Bureau of Economic Analysis (BEA), clearly show that we are not really in an economic recovery.
Once the recession ended, we should have seen economic growth continue to accelerate after the 2.4 percent growth in 2010. Instead, economic output has been more sluggish after each year since 2010. These charts, using data from the Bureau of Economic Analysis (BEA), clearly show that we are not really in an economic recovery.
In fact, the trend is alarming. Consumers are still struggling (there are still 100,000 jobless in the country), business confidence declined in 2012 (equipment & software investment grew by under 5 percent), the global economy shows the same declining growth pattern as the United States (exports), and government spending on goods and services has declined.
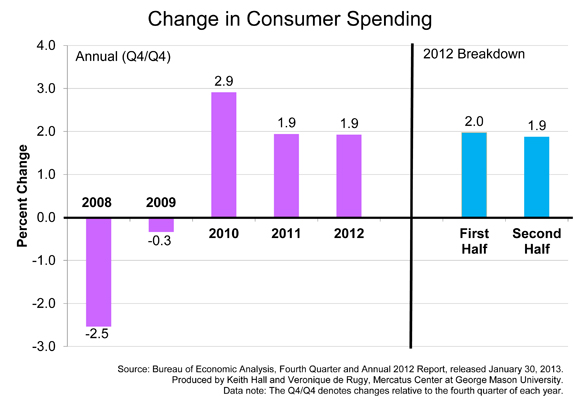
A half-year breakdown of 2012 suggests that these indicators remained remarkably consistent. The first half was nearly identical to the second half.
- GDP growth fluctuated by 0.1 percent in 2012, showing no improvement
- Consumer spending stagnated and remained at 1.9 percent, the same as the year before
- Business confidence was cut in half as investors and business owners continually
adjusted to the uncertainties of the fiscal cliff deal and numerous political showdowns - Exports declined precipitously from an acute growth of 1.4 percent in 2012, down from
8.8 percent growth in exports in 2010 - Housing investment grew by 14.4 percent in 2012, up more than three times the change
in 2011.


