- | Regulation Regulation
- | Data Visualizations Data Visualizations
- |
The High Correlation between Agency Employment and Agency Regulations
These charts use the regulatory database RegData, which offers annual statistics on federal regulations produced by each federal regulatory agency. We find that agencies with a growing annual regulatory output—as measured by restrictions, or words used in legal language to either obligate or prohibit an action—typically will also see increases in their employment totals.
These charts use the regulatory database RegData, which offers annual statistics on federal regulations produced by each federal regulatory agency. We find that agencies with a growing annual regulatory output—as measured by restrictions, or words used in legal language to either obligate or prohibit an action—typically will also see increases in their employment totals.
These charts extend our previous analysis examining the relationship between agency budgets and restrictions. This combined dataset of agency employment, agency budgets, and agency restrictions allows us to examine the relationship over time between three data series: the number of regulatory restrictions an agency published, the agency’s full time-equivalent employee count, and its budget. The first chart shows aggregate totals for employees and restrictions over time. The second chart shows totals for employees, budgets, and restrictions indexed relative to their 1975 values.
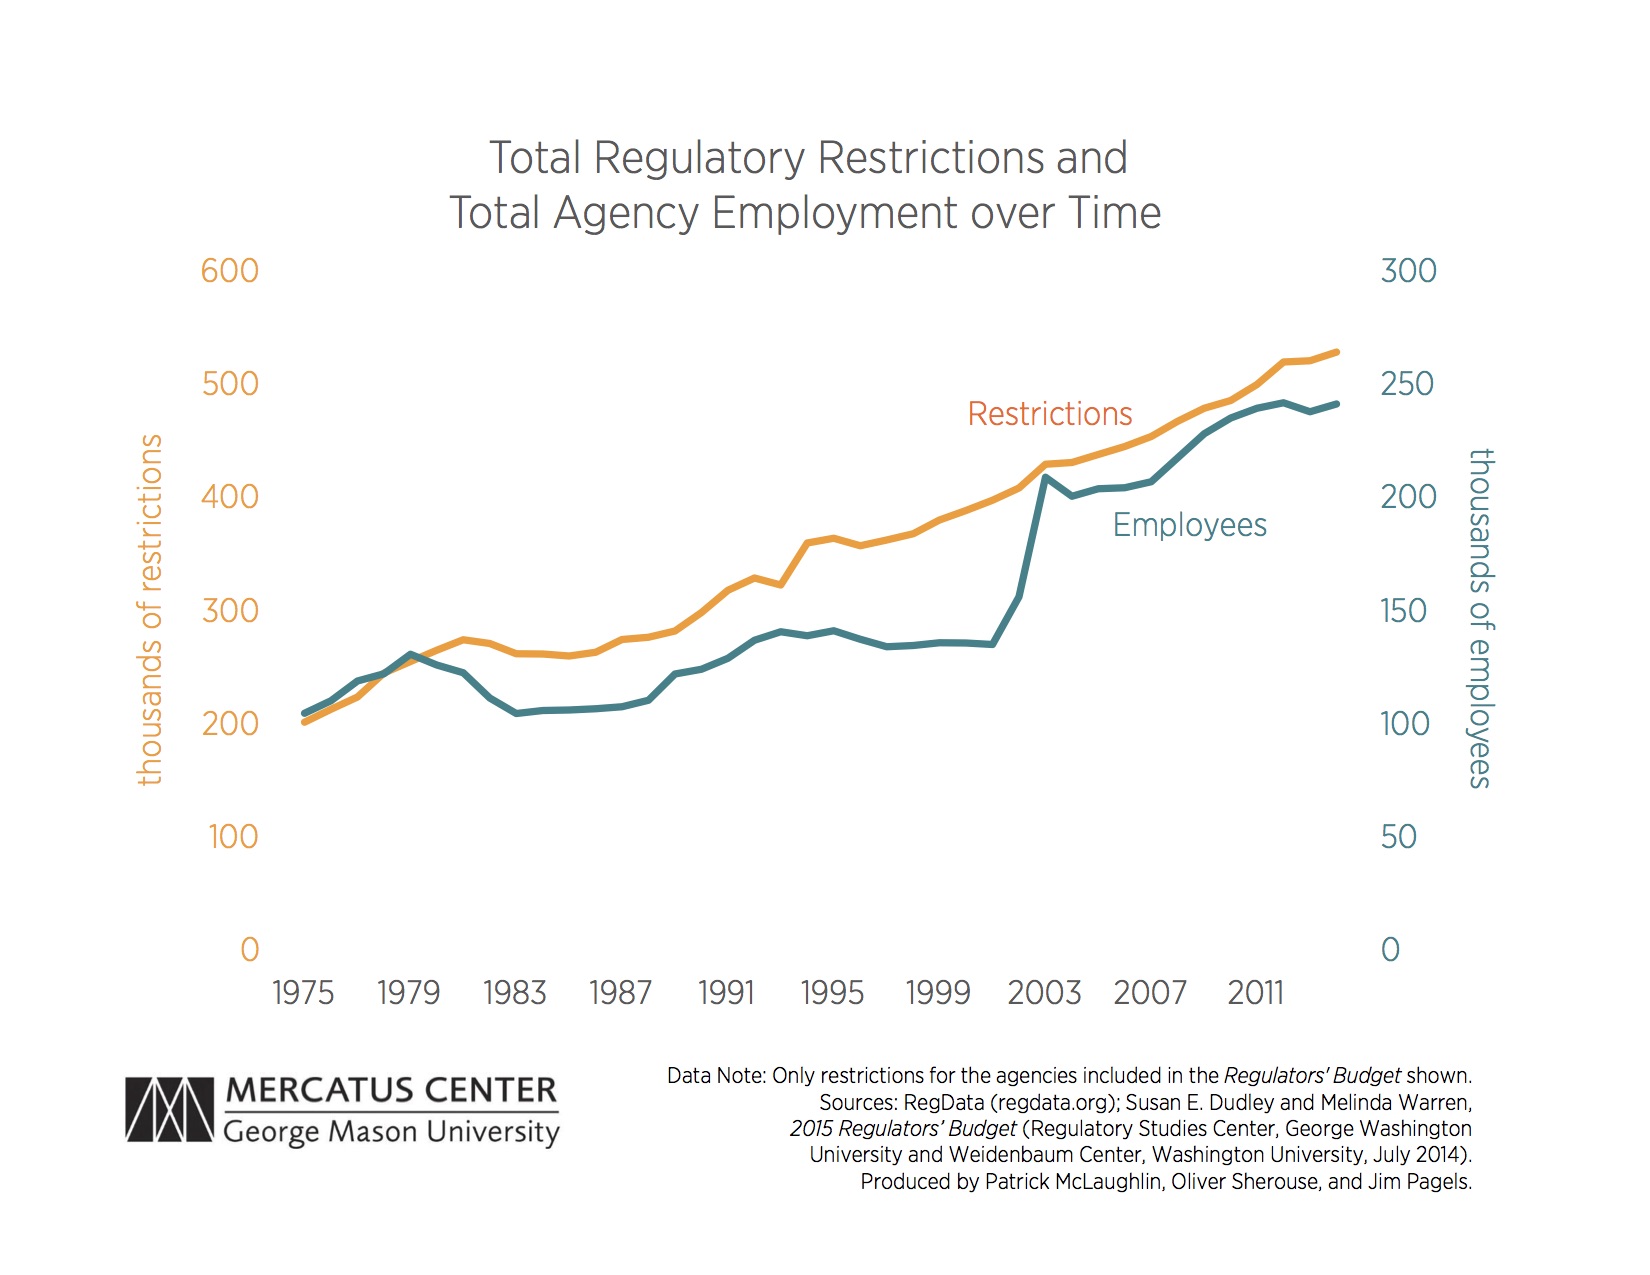
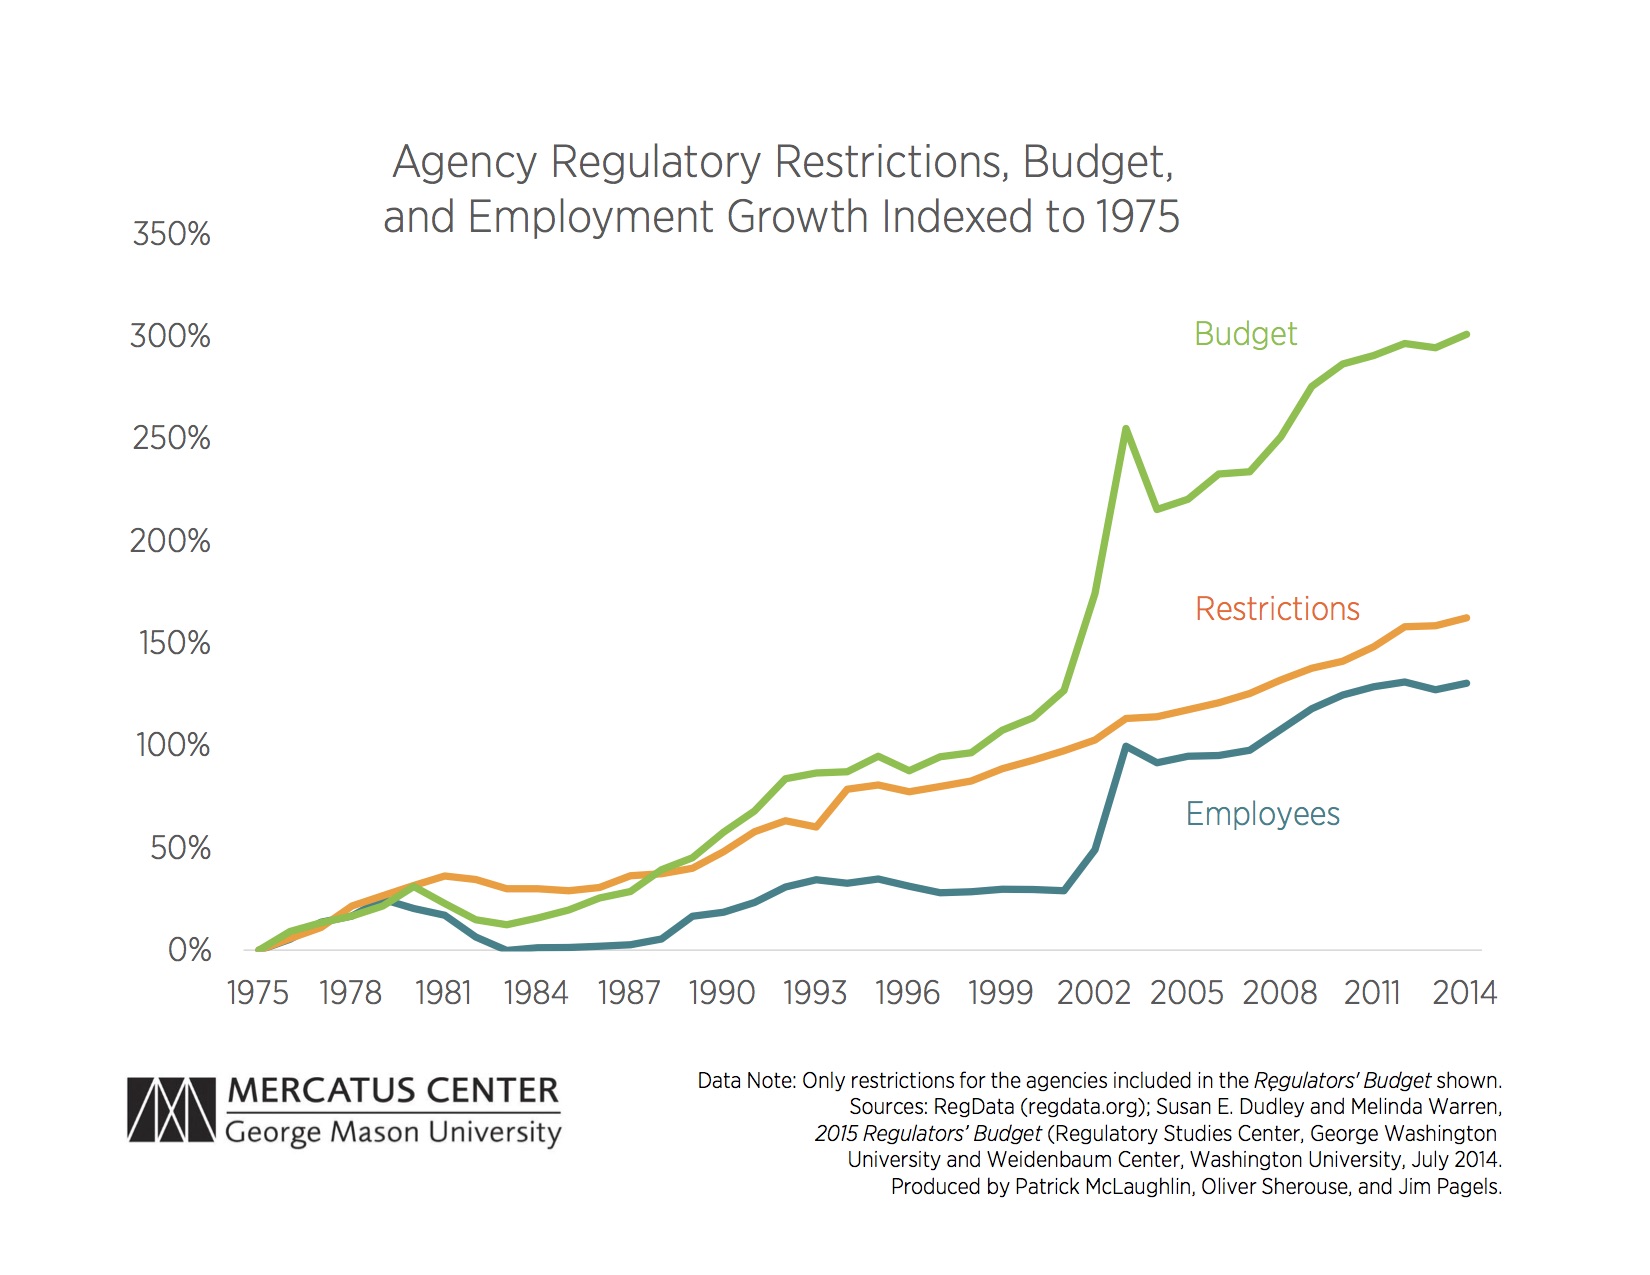
The three series—total agency restrictions, budget, and employment—all increase over the window for which we have data, 1975–2014. The correlation between the total of all regulatory restrictions and agency employment equals 0.93, a slightly higher correlation than the 0.91 relationship we previously found between budgets and restrictions. These figures only include restrictions for the agencies included in the Regulators’ Budget. RegData covers all government offices that publish in the Code of Federal Regulations, while the Regulators’ Budget is less comprehensive.
The large spike in total agency budgets and employees from 2002 to 2003 is a result of the surge in employment at the Transportation Security Administration (TSA) in response to the September 11 terrorist attacks. Congress created the TSA in 2001 and it quickly became one of the federal agencies with both a large budget and large employee count, although most of its employees do not produce new restrictions.
The third chart shows restrictions and employment for all agencies between 1975 and 2014, plotted as transparent, overlapping points. As expected with such highly correlated series, we observe most points along the 45-degree line. However, there is some variance from year to year and agency to agency.
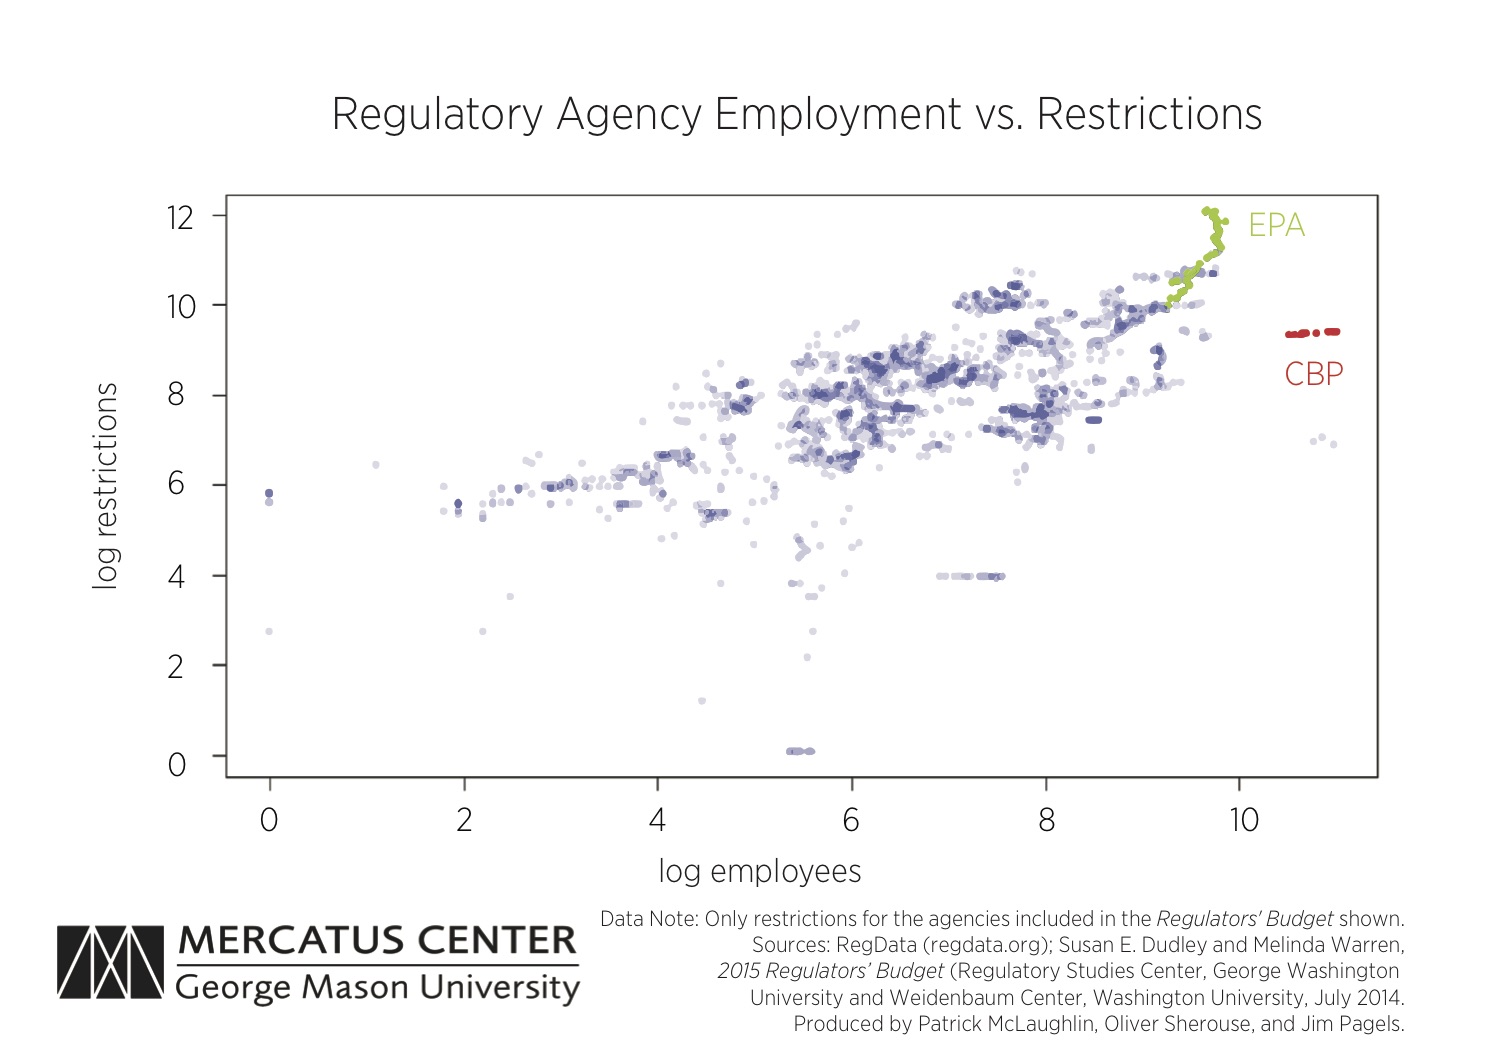
Two large regulatory agencies, the Environmental Protection Agency (EPA) and Customs and Border Protection (CBP), present interesting cases of agencies that deviate from the general trend. The EPA, which has the most restrictions, promulgates relatively more restrictions than its employment trend would suggest, and the CBP, which has the largest employment, presents the reverse case. We will discuss these two agencies in further detail in our next chart.
As we previously found with agency budgets, the correlation between agency employees and restrictions is high. That high correlation by itself does not, however, necessarily indicate a causal relationship in either direction. Our hope is that by highlighting these correlations we will aid future research into the regulatory process and its outcomes.

