- | Government Spending Government Spending
- | Data Visualizations Data Visualizations
- |
Income Distribution in the United States
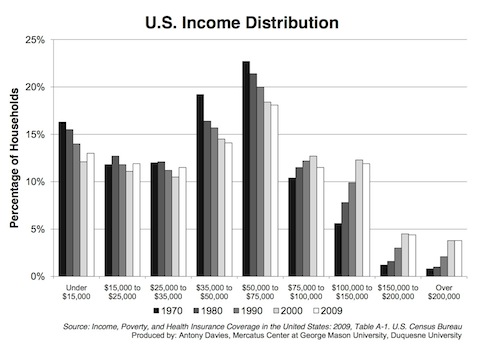
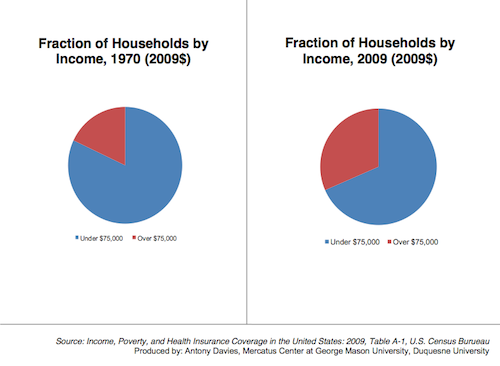
Using CBO data on income disparity published in 2010, Antony Davies shows a sharp downward trend in the number of lowest income households – the poorest of the poor are disappearing. For 40 years, the poor and middle-class have been disappearing – they have become richer.
In the charts below, economist Antony Davies shows how the number of households (relative to the population) in various income brackets have changed over the past 40 years. Using CBO data on income disparity published in 2010, Davies shows a sharp downward trend in the number of lowest income households – the poorest of the poor are disappearing. After adjusting for inflation, the numbers of households in all of the income groups below $75,000 declined or held steady, while the number of households (relative to the population) earning above $75,000 grew. For 40 years, the poor and middle-class have been disappearing – they have become richer.