- | Regulation Regulation
- | Data Visualizations Data Visualizations
- |
Measuring the Dodd-Frank Act (and Other Major Acts) with RegData 2.0
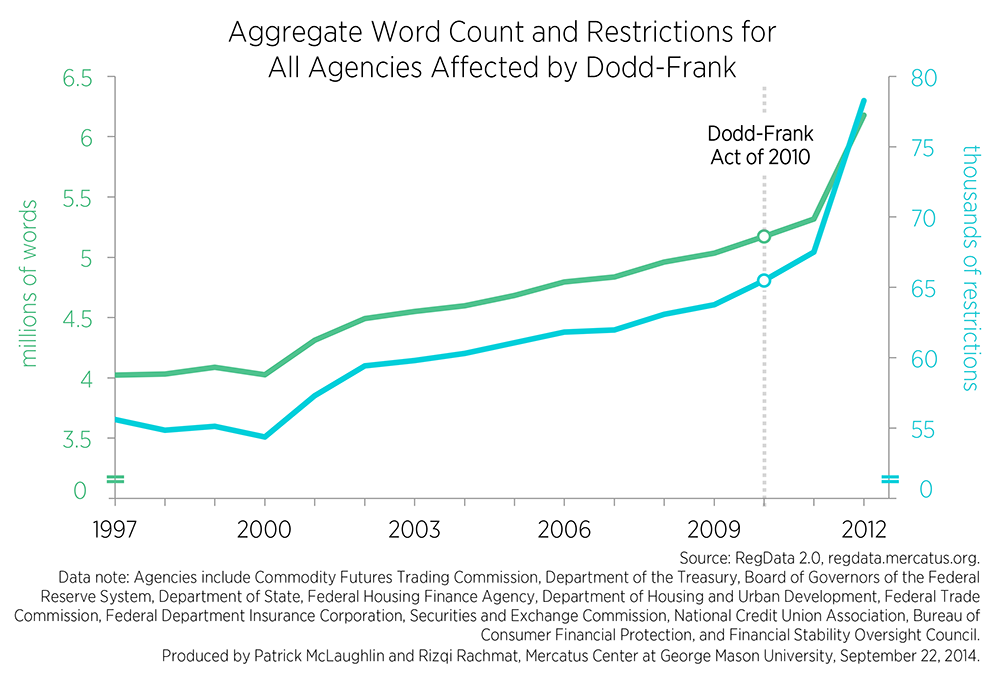
This chart depicts two data series from RegData 2.0—word counts and restriction counts. Each series contains aggregated statistics for all federal regulatory agencies that were required to engage in rulemaking by the Dodd-Frank Act of 2010.
RegData 2.0 can be used to examine how agencies’ regulatory stocks respond to major acts of Congress. This chart examines the regulatory stocks of agencies affected by the Dodd-Frank Act of 2010, which required several agencies to create new regulations or substantially modify existing regulations. The result is a notable surge in regulations produced by those agencies following the passage of the Dodd-Frank Act.
This chart depicts two data series from RegData 2.0—word counts and restriction counts. Each series contains aggregated statistics for all federal regulatory agencies that were required to engage in rulemaking by the Dodd-Frank Act of 2010.
The following agencies, which were affected by Dodd-Frank, are included: Securities and Exchange Commission, Commodity Futures Trading Commission, Federal Deposit Insurance Corporation, Office of the Comptroller of the Currency, Board of Governors of the Federal Reserve Bank, Financial Stability Oversight Council, Office of Financial Research and some other offices at the Department of Treasury, Consumer Financial Protection Bureau, National Credit Union Administration, Department of Housing and Urban Development’s Office of Community Planning and Development, Federal Housing Finance Agency, Federal Housing Administration and some other offices at the Department of Housing and Urban Development, Office of Thrift Supervision (still in print in 2012), State Department, and Federal Trade Commission.
Word counts from these agencies are measured on the left-hand axis in millions of words. This group of agencies published 4,022,233 words in 1997. These agencies’ total word count grew by 1,149,828—a 28.5 percent increase in total and a roughly 2.2 percent annual growth rate—between 1997 and 2010, when Dodd-Frank was signed into law. Between 2010 and 2012, the agencies’ word count grew from 5,172,061 to 6,176,953—a total increase of 19.4 percent and an average year-to-year growth rate of 9.7 percent.
Restrictions exhibit a similar pattern. Restrictions published by these agencies—words that create binding legal obligations such as “shall,” “must,” and “prohibited”—grew from 55,613 in 1997 to 65,486 in 2010. This represents an increase of about 17.7 percent over that period and an average annual growth rate of 1.4 percent. After Dodd-Frank was signed in 2010, restrictions grew from 65,486 in 2010 to 78,270 in 2012—a total increase of 19.5 percent and annual growth rate of 9.8 percent, representing a seven-fold increase in the annual growth rate.
The quantification of regulations creates an opportunity to observe and understand long-term regulatory trends, their causes, and their effects. Regulations tend to accumulate over time as policymakers react to the exigencies of the day. Regulatory accumulation increases the possibility of rules interacting with or duplicating each other and could have other unintended consequences. By showing regulatory trends for a single industry across a number of regulators, RegData 2.0 can focus regulators and policymakers on areas where such interactions or duplication may occur.
Dodd-Frank primarily addressed the finance and insurance industries by requiring numerous agencies to significantly increase their rates of rulemaking. Such a significant surge in rulemaking across such a wide array of agencies—including several agencies that are independent and therefore not subject to centralized review by the Office of Management and Budget’s Office of Information and Regulatory Affairs—may have created more duplication and negative interaction effects. Whether this is the case could be better determined with a retrospective review that examines all of the Dodd-Frank rules together.

