- | Government Spending Government Spending
- | Working Papers Working Papers
- |
Regulators’ Budget Report
Expansion of Regulatory Budgets and Staffing Continues in the New Administration
This report tracks the budget of federal regulatory agencies and the staff needed to run those agencies based on the data of the Office of Management and Budget (OMB) presented by the president in

Executive Summary
This annual report from Veronique de Rugy and Melinda Warren[1] examines the Budget of the U.S. Government presented by the president to Congress for FY 2010 to track the expenditures of federal regulatory agencies and the staff needed to run these agencies. Key findings for the FY 2010 budget include the following:
- The president’s 2010 budget calls for expenditures on regulatory activities of $55.8 billion for the next fiscal year. This 2010 Regulators’ Budget request is larger than the estimated budget of $53.6 billion in FY 2009 and reflects both a nominal increase and an increase in real, inflation-adjusted terms.
- If history repeats itself, the 2010 outlays are likely to be much higher than the budget estimates. To date, the spending on regulatory activities for 2009 has already significantly outpaced the figure requested by the president in February of 2008 for the 2009 budget. Last year, the president requested an increase in spending for 2009 of 6.4 percent over 2008 spending. A year later, the 2009 budget is estimated to be 14.1 percent larger than the 2008 budget.
- Between 2009 and 2010, regulatory spending is projected to grow by 4.2 percent. It is notable that this spending increase follows the sizable regulatory spending increase of FY 2009, the largest estimated spending increase since 1980.
- Staffing at federal regulatory agencies is budgeted to increase 2.3 percent in 2010 to 272,475 full-time equivalent employees. That is an increase of 6,175 employees over the 2009 level of 266,300.
- The Department of Homeland Security (DHS)—especially the Customs and Border Protection portion of DHS’s regulatory budget—continues its steady expansion. DHS accounts for the largest staff increases in the 2010 Regulators’ Budget. However, the Environment subcategory is scheduled to receive the biggest percentage increase in spending over 2009.
- During both of his terms, President George W. Bush presided over the largest dollar increase in regulatory spending. His 2002 and 2003 regulatory budgets were among the 10 biggest annual increases in regulatory spending in the last 50 years.
- Throughout President George W. Bush’s term (FY 2001–2009), regulatory spending grew at an estimated 9 percent annually. However, this number is skewed by the estimated 14.1 percent spending increase in FY 2009 which occurred under both the Bush and Obama administrations.
Introduction
This report tracks the budget of federal regulatory agencies and the staff needed to run those agencies based on the data of the Office of Management and Budget (OMB) presented by the president in his FY 2010 Budget of the United States. A joint product of the Mercatus Center at George Mason University and the Murray Weidenbaum Center on the Economy, Government, and Public Policy at Washington University in St. Louis, this report continues an effort begun in 1977 by the Weidenbaum Center (formerly the Center for the Study of American Business).
Tracking the expenditures of federal regulatory agencies and the trends in regulatory spending over time helps analysts monitor one aspect of the cost of regulations: the direct cost to regulate the economy and taxpayers’ lives. We know that if the Regulators’ Budget increases, it means that the direct cost of running regulatory agencies increases, and when it goes down, the cost decreases.
However, it does not say anything about these agencies’ output. For instance, an increase in the Regulators’ Budget could be the sign of an increase in regulatory activities followed by an increase in the amount of regulations issued. But it could also be the result of an effort to apply better oversight to the regulatory process, more science that supports the regulations, more enforcement of existing regulations, or an increase in any number of activities that these agencies undertake.
Also, we know that regulations impose social costs on individuals and businesses beyond the direct tax dollars expended to write and enforce them. First, there is a cost that American businesses, stockholders, and consumers must pay for compliance. Then, regulations by their nature alter choices made by individuals and firms, which imposes opportunity costs on those entities. Both are considerably larger than the costs presented in this report. However, these compliance costs will not be discussed in this report.
As Table 1 shows, the 2010 budget request, the first one of the Obama administration, calls for expenditures on regulatory activities of $55.8 billion in FY 2010, a 3.2 percent increase (in real, inflation-adjusted terms) from FY 2009. This is a much slower expected growth rate than the 13 percent growth rate between FY2008 and FY 2009. It should be noted, however, that when President Bush requested his budget for 2009, the outlays were expected to increase by only 4.6 percent in real terms over 2008.[2] That is a significant gap between the estimated and the actual outlays.
Staffing at federal regulatory agencies is budgeted to increase 2.3 percent in 2010 to 272,475 full-time equivalent employees. This is an increase of 6,175 employees over the 2009 level of 266,300. Table 2 summarizes the staffing at federal regulatory agencies between 1960 and 2010.
This report provides detailed statistics on the spending and staffing that have supported federal regulatory activities since 1960, as well as the levels requested for FY 2010. Expenditures are examined in nominal and real (constant 2000) dollars, and staffing levels are examined by agency and by regulatory category.
Overview of the 2010 Regulators’ Budget
This report tracks the spending and staffing of 68 departments and agencies. As has been the practice in past reports, it divides federal regulatory activities into two main categories. The first category, social regulation, includes regulatory activities that address issues related to health, safety, and the environment, such as the Environmental Protection Agency, the Occupational Safety and Health Administration, the Food and Drug Administration, and the Transportation Security Administration. Their activities are generally limited to a specific issue, but they have the power to regulate across industry boundaries. This report further divides the social regulation category into six subcategories: (1) consumer safety and health, (2) homeland security, (3) transportation, (4) workplace, (5) environment, and (6) energy.
Economic regulatory agencies oversee a broad base of activities—in particular, industries using economic controls such as price ceilings or floors, quantity restrictions, and service parameters. The Securities and Exchange Commission, the Federal Communications Commission, and the Federal Energy Regulatory Commission, for example, administer economic regulations. The economic regulation category is divided into three subcategories: (1) finance and banking, (2) industry-specific regulation, and (3) general business. Note that the industry-specific regulation category includes economic regulation of the transportation and energy industries.
The expenditure data in this report are based on outlays reported in the Budget of the U.S. Government. In addition, personnel data in terms of full-time equivalent (FTE) employees are reported. Note that figures for 2009 and 2010 are estimates. The 2009 figures generally reflect the budget Congress appropriated for the current year, while the 2010 figures reflect the outlays and personnel embodied in the president’s budget request to Congress for each program area.
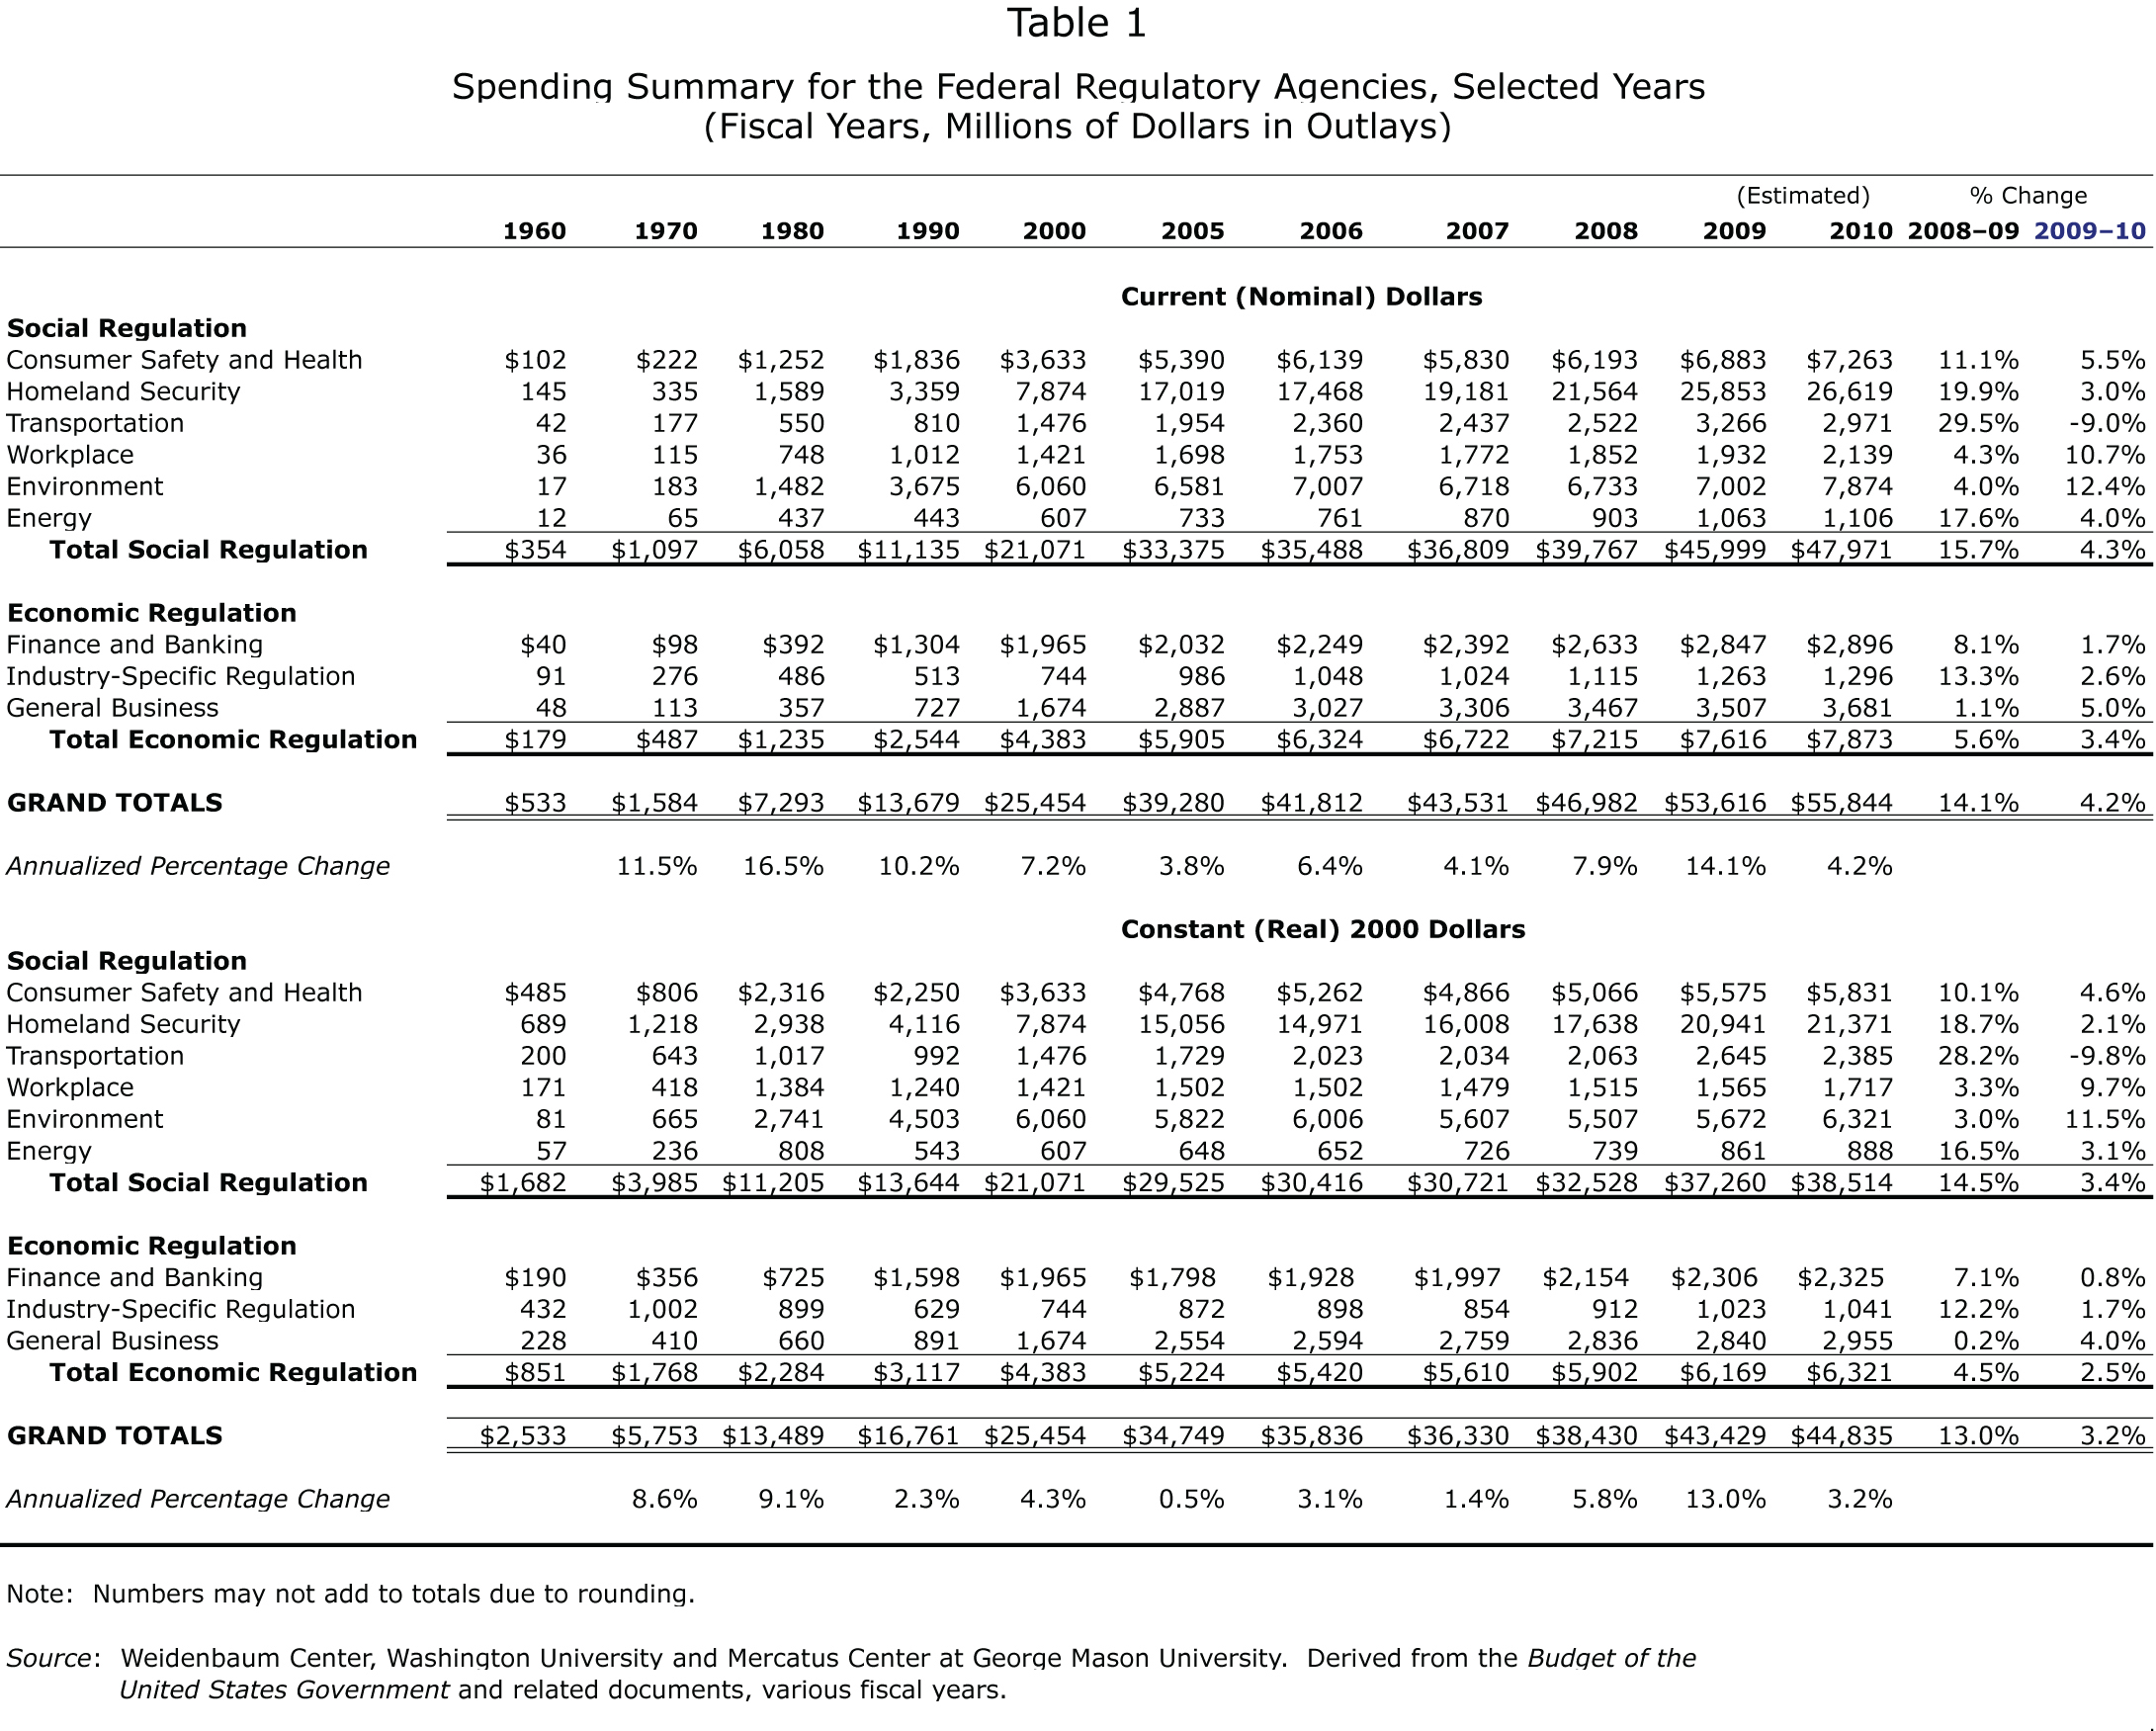
Table 1: Spending Summary for the Federal Regulatory Agencies, Selected Years (Fiscal Year, Millions of Dollars in Outlays)
Table 1 summarizes spending for regulatory activities by category and subcategory for decennial years from 1960 to 2000, as well as annually from 2005 through 2010.
The Regulators’ Budget request for FY 2010 is $55.8 billion. This reflects a 4.2 percent nominal increase over FY 2009, or a real increase of 3.2 percent. This growth in budgeted outlays for regulatory activities comes despite the -13 percent real growth projected decrease in real term of the budget for 2009, but represents a slightly lower rate of growth than in other recent years.
About 86 percent of the Regulators’ Budget is devoted to social regulations. The FY 2010 budget request for administering and enforcing social regulation is $48.0 billion, a nominal increase of 4.3 percent from the 2009 social regulation budget of $46.0 billion. This is a 3.4 percent increase in real terms after a 14.5 percent real increase between fiscal years 2008 and 2009. Budget outlays for social regulation activities in 2007 were $36.8 billion.
Budget requests for the transportation category reflect a real decrease in outlays over 2009, while all other categories show increased outlays. This year, the environmental category receives the largest dollar and percentage increases among the social regulation subcategories: the president’s 2010 budget requests an additional $872 million in 2010 for environmental regulation. After adjusting for inflation, this reflects an increase of 11.5 percent from 2009. Requested outlays for federal agencies regulating consumer safety and health protection increased 4.6 percent in real terms. After an increase of 19.9 percent last year, the budget for Homeland Security is 3 percent greater in nominal terms than in 2009—a nominal increase of $766 million.
The budgets of agencies in the economic regulation category are smaller than their counterparts involved in social regulatory activity, but each category is budgeted to receive a real increase over 2009. Overall, the 2010 budget request for economic regulatory agencies is $257 million (or 3.4 percent) higher than estimated for 2009.
After an increase of 0.2 percent in 2009, the Regulators’ Budget reflects a 4 percent real increase in 2010 for agencies in the general business category. After a 7.1 percent increase in 2009, the 2010 budget request for finance and banking agencies reflects a more modest growth of 0.8 percent. The same can be said of the budget of industry-specific regulatory agencies, which will grow by 1.7 percent in 2010 after a 12.2 percent increase in 2009.
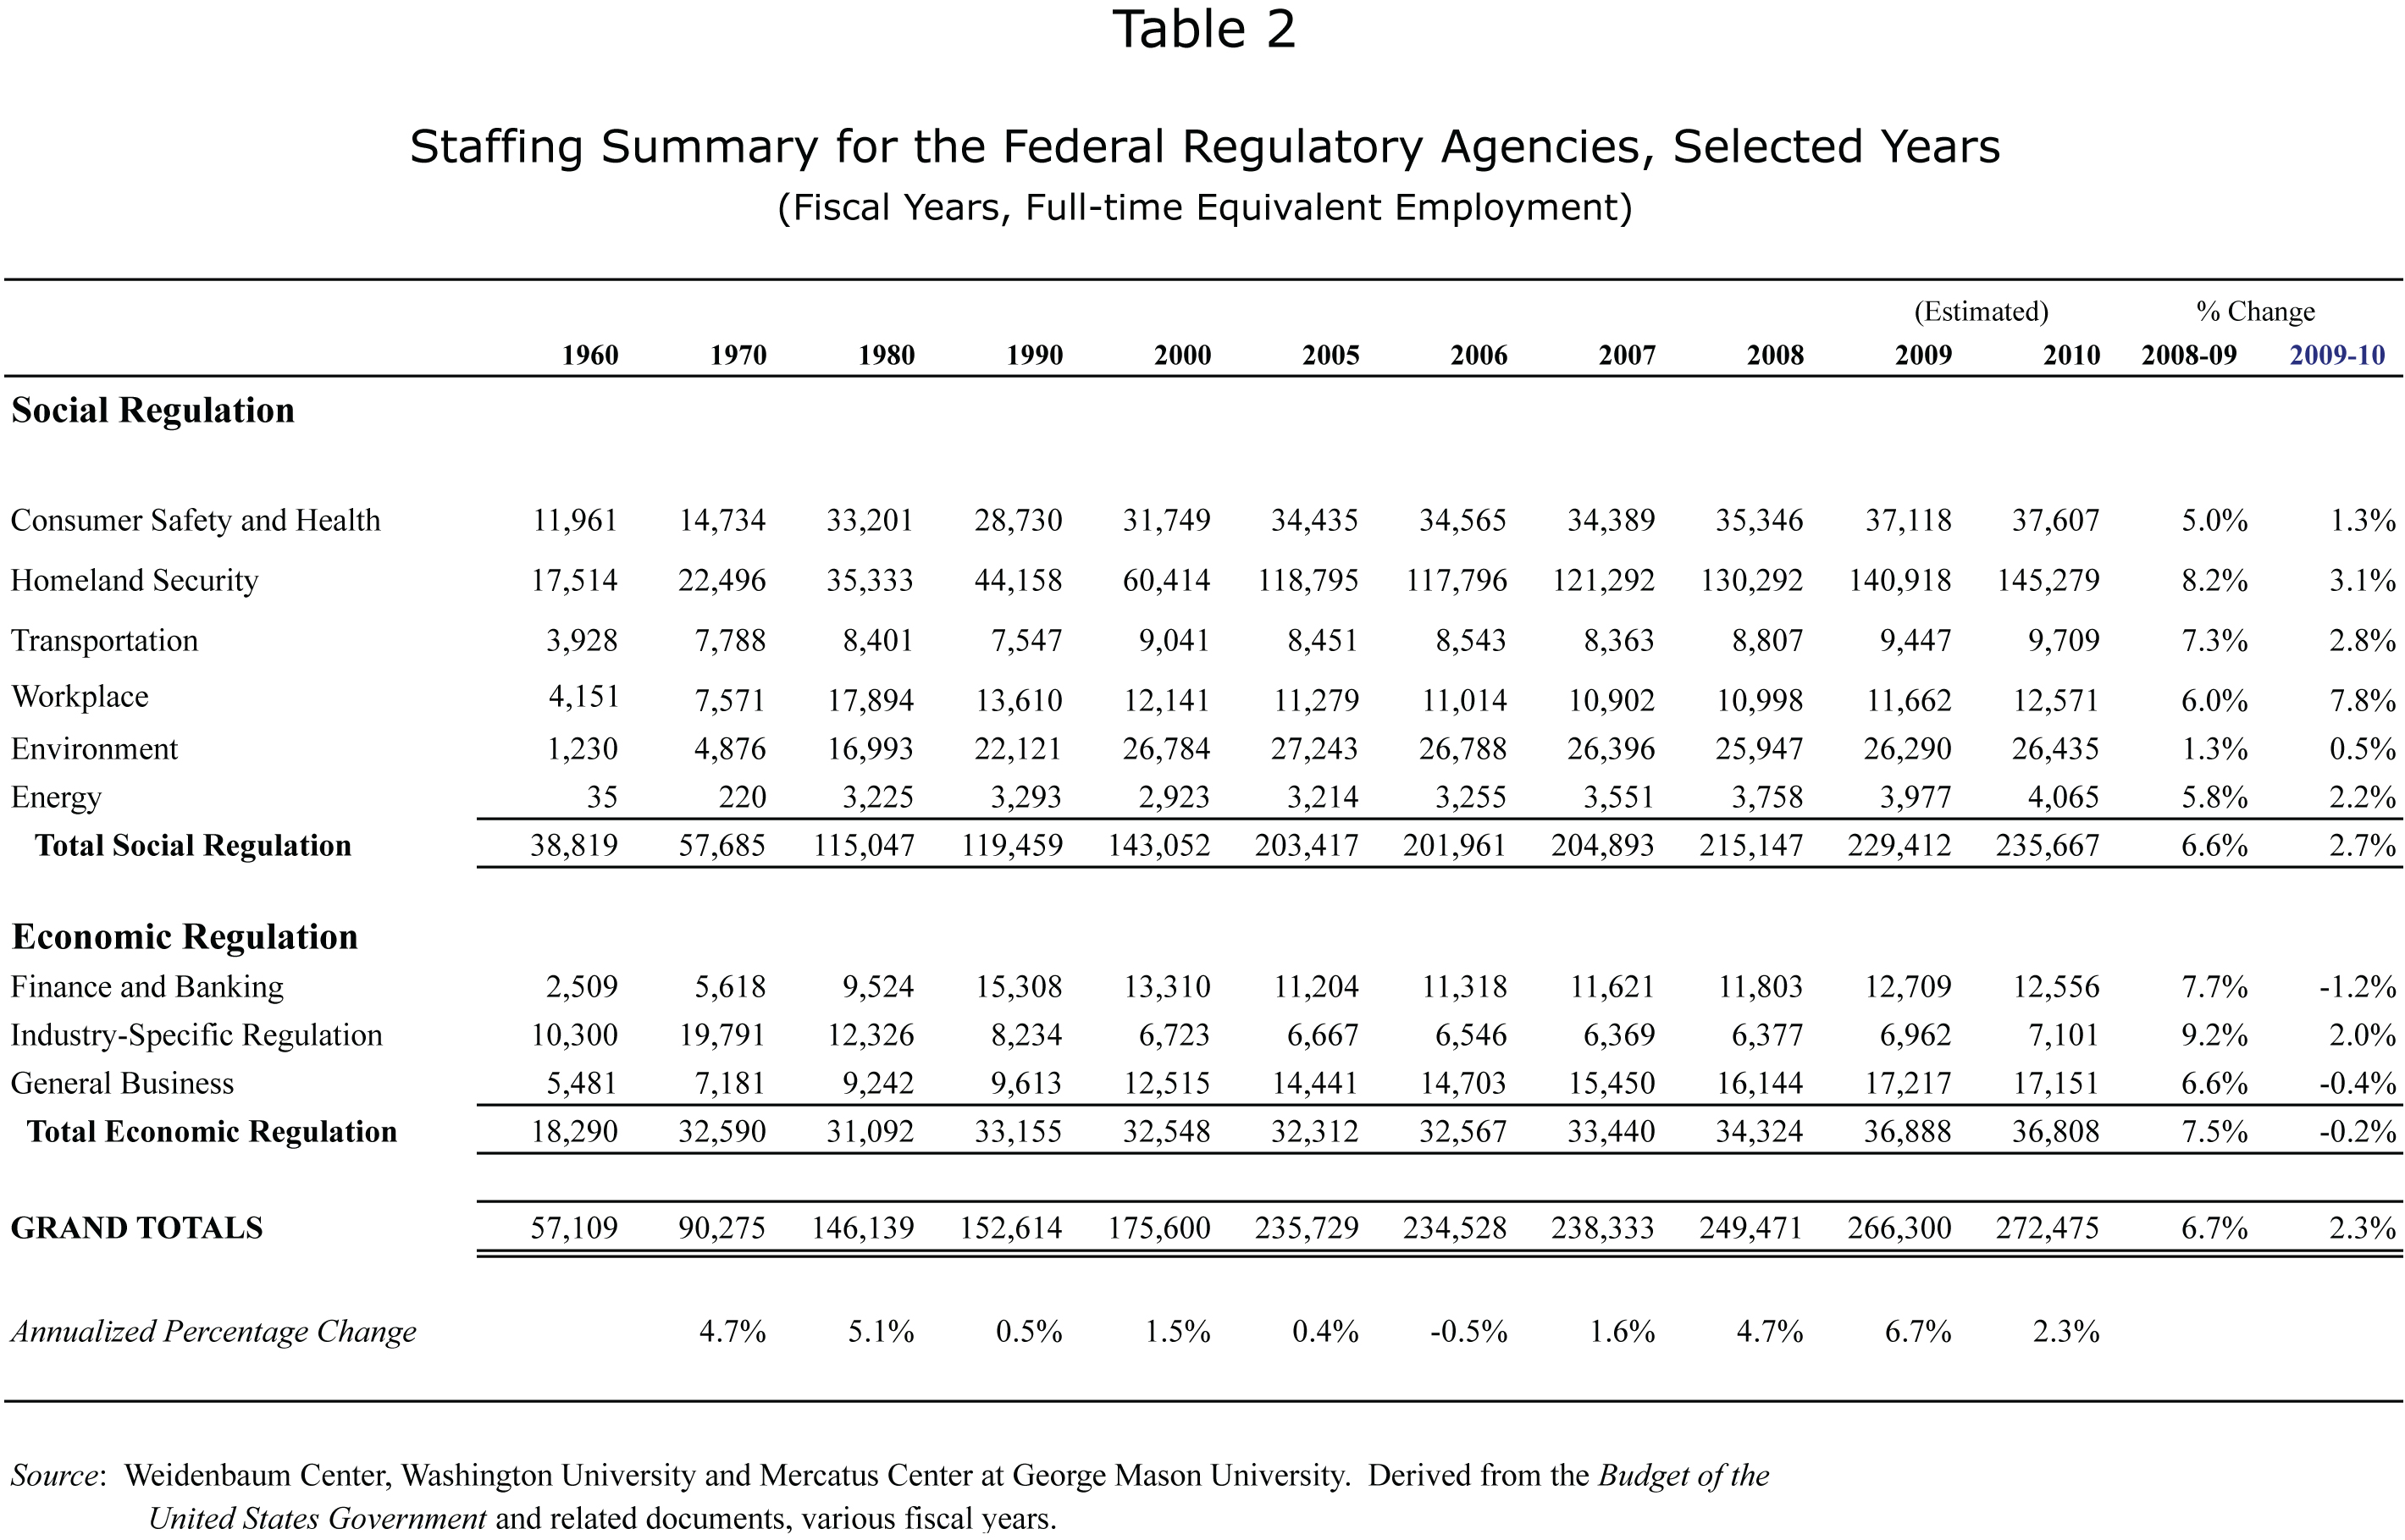
Table 2: Staffing Summary for the Federal Regulatory Agencies, Selected Years (Fiscal Years, Full-time Equivalent Employment)
Staffing at federal regulatory agencies is budgeted to increase 2.3 percent in 2010 to 272,475 FTEs. That is an increase of 6,175 employees over the 2009 level of 266,300. Table 2 summarizes the staffing at federal regulatory agencies between 1960 and 2010.
Staffing levels at agencies engaged in social regulatory activities increased 6.6 percent in 2009 and are budgeted for a 2.7 percent increase in 2010. The 2010 budget requests 235,667 full-time employees devoted to social regulation, an increase of 6,255 people above the 229,412 employed in 2009. It is also an increase of 20,520 employees over the 2008 level. The Department of Homeland Security continues to see the largest increases in FTEs with an additional 4,361 employees over 2009, representing a 3.1 percent increase. The second highest increase in the staffing levels reported in the 2010 budget can be found in the workplace subcategory, which grew by 7.8 percent with 909 added employees. None of the social regulatory categories will see a reduction in staff.
Overall, personnel at the economic regulatory agencies are projected to decrease 0.2 percent in 2010 to 36,808 FTEs. Only the industry-specific regulation subcategory is projected to increase in FY 2010, growing by 139 FTEs (a 2 percent increase over 2009). However, if last year is any guide, these two subcategories will end up growing eightfold above the projected amount.[3] Overall, agencies devoted to economic regulation are budgeted to receive staffing changes amounting to a decrease of 80 FTEs.
Trends in Federal Regulatory Spending, 1960–2010
Figure 1 shows the changes in real (inflation-adjusted) expenditures on regulatory agencies since 1960. Numbers and percentages in this section are in constant 2000 terms unless otherwise indicated.
While spending has generally increased over time, the rate of growth has varied depending on the priorities of elected officials in the executive and legislative branches of the federal government. For example, regulatory expenditures declined in the early years of the Reagan administration, and again in 1996 during the Clinton administration, reflecting a desire to move toward deregulation and to downsize government spending and intervention in the economy and in Americans’ lives.
In 1960, fiscal outlays directed at administering regulation were $533 million (equivalent to $2.5 billion in 2000 dollars). By the end of the decade, total spending by federal regulatory agencies had grown to $1.6 billion ($5.8 billion in 2000 dollars). This represents a real annual growth rate of 8.6 percent and a total increase of 127.1 percent over the decade. Most of this growth—more than $2 billion—occurred in social regulatory agencies (which experienced a real 136.9 percent increase in annual budgets over the decade). Economic regulatory programs expanded more slowly, by $0.9 billion (or 107.8 percent) over the period.
The 1970s brought increased expenditures on federal regulation. Over that decade, real spending at regulatory agencies grew by $7.7 billion or 134.5 percent (9.1 percent per year on average). Social regulatory expenditures continued to grow rapidly and increased by $7.2 billion (181.2 percent), while economic agencies showed a much smaller increase of $0.5 billion (29.2 percent). Most of the growth occurred in the early part of the decade, when several of the significant social regulatory agencies (particularly the Environmental Protection Agency and the Occupational Safety and Health Administration) were formed. During the 1970s, expenditures to fund social regulatory agencies grew from under 70 percent of the total Regulators’ Budget to over 80 percent. Double-digit increases in the first three years preceded much slower growth during the latter part of the decade.
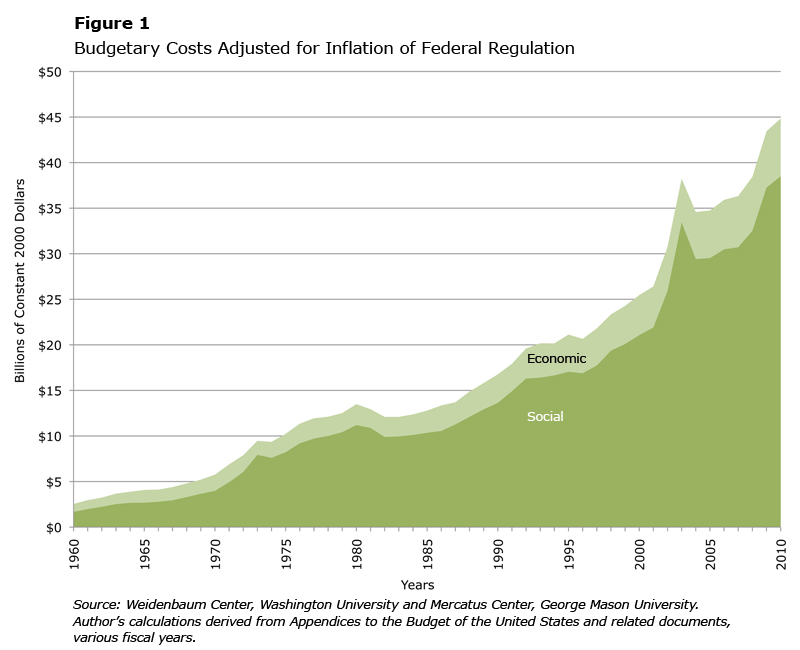
Figure 1: Budgetary Costs Adjusted for Inflation of Federal Regulation (Click to Enlarge)
Total annual expenditures on regulatory agencies declined by 5.2 percent between 1980 and 1985, but rebounded in the second half of the decade, increasing by 31.1 percent overall between 1985 and 1990. Annual spending on regulatory activities at the end of the decade was $3.3 billion more than at the beginning. Throughout the decade, spending on economic regulation increased at a faster rate¾36.5 percent between 1980 and 1990¾than spending on social regulatory agencies, which grew by 21.8 percent over the same period. Spending increased by an average of 2.3 percent per year over the decade.
Spending on regulatory agencies continued to increase in the 1990s for a total increase of 51.9 percent over the decade, or $8.7 billion. The budgets of agencies administering social regulations increased by 54.4 percent over the decade and those related to economic regulations increased by 40.6 percent. The first few years of the decade witnessed greater percentage increases—an average of 7.5 percent per year between 1990 and 1992, compared to an average of 4 percent per year between 1992 and 2000. The Regulators’ Budget actually declined in real terms in 1994 and 1996. On an annual basis, the real rate of increase averaged 4.3 percent over the decade.
Between 2000 and 2010, real-term budgets devoted to regulatory agencies increased significantly. The FY 2010 budget calls for expenditures that are 76.1 percent higher than in 2000—an increase in real spending on regulatory activities of $19.4 billion between 2000 and 2010. The budgets of agencies administering social regulations grew by 82.8 percent, and those involved in economic regulation grew by 44.2 percent in real terms over that period.
On average, the Regulators’ Budget has grown a little more than 6.2 percent per year since 2000. Double-digit increases in fiscal years 2002, 2003, and 2009 (16.4, 24.3, and 13 percent respectively) drive the large average and reflect the response to the terrorist attacks of September 11, 2001, and the response to the current economic crisis.
The Regulators’ Budget declined 9.5 percent in 2004 and grew by less than 1 percent in 2005. In 2006 and 2007, however, the Regulators’ Budget increased by 3.1 and 1.4 percent, respectively. In 2008, the Regulators’ Budget increased by 5.8 percent, the 2009 budget represents a 13 percent increase over 2008 in real terms and the 2010 budget represents a further increase of 3.2 percent.
Trends in Financial Regulatory Spending
In light of the recent financial crisis, it is useful to look at the trends in regulatory spending and staffing in the last 50 years. There is a misconception that deregulation, especially during the last eight years, has been the central cause of the financial crisis. In large part, this perception stems from the rhetoric of the Republicans in power at the time and their emphasis on the costly burdens that regulation places on business. As George Mason University Professor Tyler Cowen reminded us recently, rhetoric about regulation does not necessarily reflect reality. For instance, he wrote in the New York Times that, contrary to the myth,
[t]he [Bush] administration did little to alter a regulatory structure that was built over many decades. Banks continue to be governed by a hodgepodge of rules and agencies including the Office of the Comptroller of the Currency, the international Basel Accords on capital standards, state authorities, the Federal Reserve and the Federal Deposit Insurance Corporation. Publicly traded banks, like other corporations, are subject to the Sarbanes-Oxley Act.
And legislation that has been on the books for years—like the Home Mortgage Disclosure Act and the Community Reinvestment Act—helped to encourage the proliferation of high-risk mortgage loans. Perhaps the biggest long-term distortion in the housing market came from the tax code: the longstanding deduction for mortgage interest, which encouraged overinvestment in real estate.
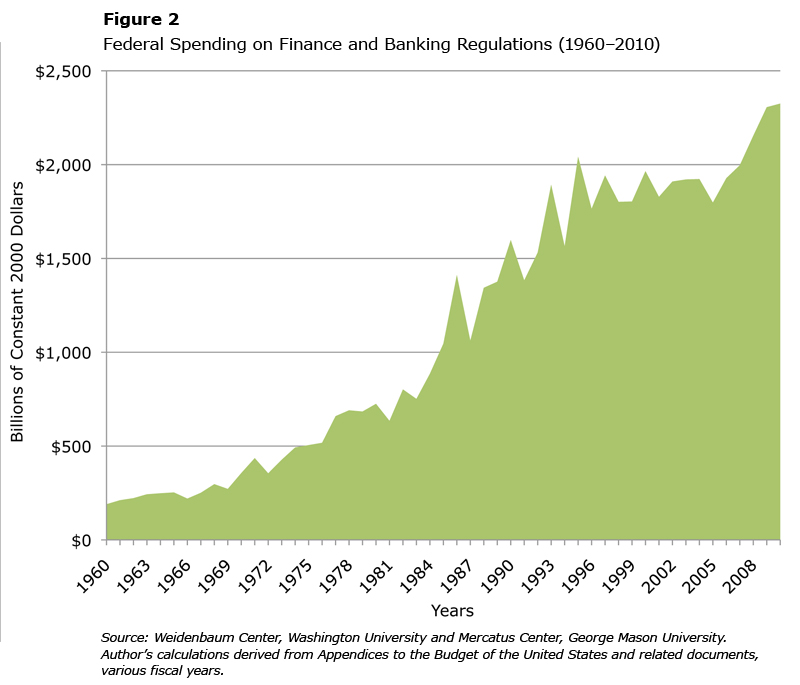
Figure 2: Federal Spending on Finance and Banking Regulations, 1960–2010 (Click to Enlarge)
In short, there was plenty of regulation—yet much of it made the problem worse.
For instance, a look at regulatory spending in this report shows an expansion in financial regulation spending, rather than a decrease. For the proposed 2010 fiscal budget, spending on regulatory agencies is to grow by 0.8 percent, following the 7.1 percent growth rate for last year and continuing a long-term expansionary trend. More specifically, for the regulatory category of finance and banking, inflation-adjusted expenditures have risen 45.5 percent from 1990 to 2010. This is relatively characteristic of the trend in the last 50 years. Figure 2 shows real federal spending on finance and banking regulations between 1960 and 2010. As we can see, with some exceptions, regulatory spending on finance and banking has steadily increased over the last 50 years. The last 10 years follow the same pattern.
Federal Spending on Finance and Banking Regulations (1960–2010)
Finally, in FY 2010 spending on regulatory activity in the finance and banking subcategory is budgeted to grow 0.8 percent to reach $2.9 billion in 2010. This follows a 7.1 percent increase in 2009. Within this subcategory, the largest percentage increase occurs in the budget of the Financial Crimes Enforcement Network (16 percent) while the largest decrease (28.5 percent) occurs in the Office of Thrift Supervision.
Because of the current financial crisis, there might have been some expectation that spending in the finance and banking subcategory would be substantially higher in this report. Calls for comprehensive reform of the financial regulatory system have intensified in the past year. The FY 2011 budget will most likely include significant increases in this area. Some of the reforms likely to be considered in the 111th Congress include reform of the securitization process, federal regulation of credit-rating agencies, creation of a risk-management regulator, federal regulation of hedge funds, federal regulation of credit default swaps, and consolidation of federal financial regulatory agencies. There is even talk of creating a Consumer Financial Products Safety Commission.[4]
Trends in Federal Regulatory Staffing, 1960–2010
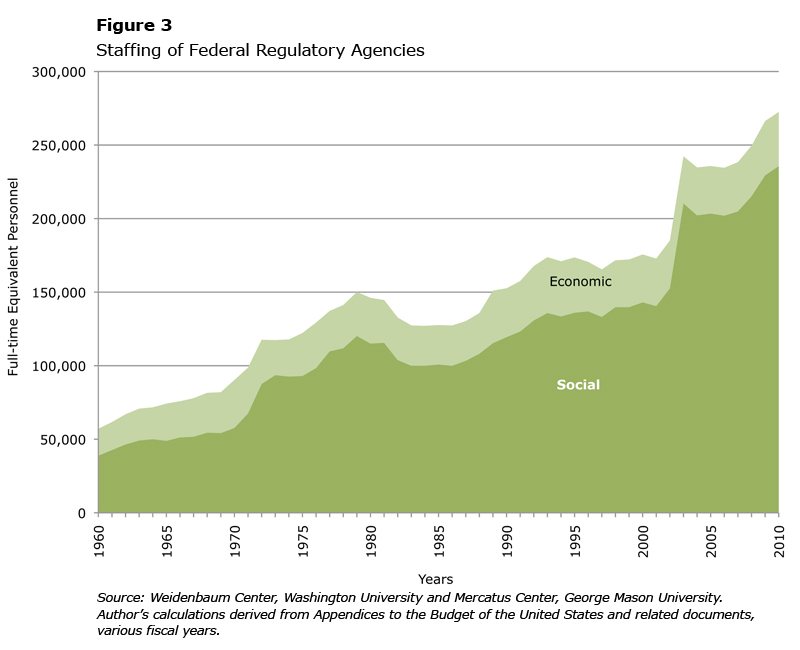
Figure 3: Staffing of Federal Regulatory Agencies (Click to Enlarge)
Figure 3 shows the trends in staffing at federal regulatory agencies between 1960 and 2010. In 1960, 57,109 full-time employees worked on writing, administering, and enforcing regulations at federal agencies. By 1970, that number had grown 58.1 percent to 90,275, an increase of 33,166 people. While social regulatory staffing grew by 18,866 (48.6 percent), workers at economic regulatory agencies increased by 14,300 (78.2 percent) during the decade.
During the 1970s, the number of personnel at regulatory agencies grew by 55,864, or 61.9 percent. Social regulatory agencies gained 57,362 additional staff, and economic agencies lost nearly 1,500 employees.
Staffing at regulatory agencies was cut back significantly in the early 1980s; between 1986 and 1990, staffing at regulatory agencies declined by 12.7 percent (12.4 percent at the social agencies and 13.8 percent at the economic regulatory agencies). Starting in 1987, the trend reversed, and the second half of the decade saw increases of 19.8 percent—19.5 percent for social regulatory agencies and 21 percent for economic regulatory agencies. By 1990, staffing at federal regulatory agencies was 4.4 percent higher than it had been in 1980 (a net increase of almost 6,500 employees). Social regulatory agencies increased staffing by 3.8 percent, and economic regulatory staff grew by 6.6 percent during this decade.
The staffing increases that began in the late 1980s continued in the 1990s. Between 1990 and 1995, the number of full-time personnel at regulatory agencies increased by 13.8 percent overall (21,000 people), with increases of 13.9 percent in social regulatory agencies and 13.4 percent in economic regulatory agencies. After staffing reductions in 1996 and 1997, the decade ended with 22,986 new federal regulatory employees (a 15.1 percent increase). Social regulatory agencies added 23,593 employees (a 19.7 percent increase), while economic regulatory agencies declined by 607 employees (1.8 percent).
After a 1.6 percent reduction in 2001, staffing at regulatory agencies has increased dramatically in the twenty-first century. In 2003, the establishment of the Transportation Security Administration, with its large staff of airport screening agents, caused the federal regulatory workforce to jump 31 percent, by far the largest annual increase in the nation’s history.
The 2010 budget calls for a total regulatory staff with 96,875 more full-time regulatory employees than in 2000, an increase of 55.2 percent. The bulk of this increase in staff is at social regulatory agencies, which are budgeted to have 92,615 more employees on the payroll than in 2000, compared to 4,260 new positions in economic regulatory agencies.
Summary of Federal Regulatory Activity for Fiscal Year 2010
In his 2010 Budget Message, A New Era of Responsibility: Renewing America’s Promise, the president emphasizes his intent to “lay a new foundation for long-term economic growth and prosperity.”[5] As in his presidential campaign, the theme of change runs through the president’s budget address. He emphasizes the stark contrast between our “inherited” fiscal issues and the new climate of responsibility that he hopes to create. The 2010 Budget Message carries with it a strong image of the president’s vision for the future of regulation: he cites a “dogmatic deregulatory approach to our capital markets”[6] as the reason for the current financial crisis.
President Obama plans to cut funding for “programs that are outdated, duplicative, ineffective, or wasteful.”[7] This message is remarkably similar to that of the administration whose fiscal irresponsibility this administration “inherited.” In fact, the FY 2010 budget cuts funding for 100 programs amounting to nearly $17 billion; in FY 2009, budget cuts amounted to $18 billion across 151 programs. In general, these goals of tying the budgets of regulatory agencies to results and eliminating those that do not produce, at reasonable costs, real outcomes valued by the American public, are to be praised. Unless both the executive and the congressional branches of government insist on these goals, however, they are unlikely to be met.
The president’s attitude toward regulation is reflected in the FY 2010 budget, which calls for a 4.2 percent increase in the budget for regulatory activities. This increase follows a 14.1 percent increase in the Regulators’ Budget in FY 2009 and includes a 1.7 percent increase in the budget for finance and banking regulation.
If history is any guide, it is likely that this year, as in the past, the proposed budget cuts will not be achieved and growth in regulatory spending will not be contained at 4.2 percent. Actual outlays will be even higher than requested by the president, few programs will be terminated, and regulatory spending will far exceed the budgeted amount. For example, in FY 2009, the 4.6 percent real increase called for in the FY 2009 Regulators’ Budget preceded a 13 percent real increase in regulatory spending.
Unlike previous years, the largest dollar increase in the 2010 Regulators’ Budget is for the environment subcategory. From 2002 to 2008, Homeland Security regulatory activities received the largest increase; last year energy-related regulatory activities received the largest increase.
In the more detailed discussion of the FY 2010 Regulators’ Budget that follows, dollar amounts are presented in nominal terms, while percentage changes are in real (2000 dollar) terms.
As noted earlier, regulatory activities are divided into two categories—social and economic—and nine subcategories. The outlays devoted to social regulation are over six times larger than those devoted to economic regulation ($48.0 billion compared to $7.9 billion in 2010). Furthermore, agencies devoted to social regulation are projected to receive a 3.4 percent increase in 2010, while spending on agencies who administer economic regulation is projected to increase 2.5 percent.
Table 1 (on page 6) provides summary statistics, and appendix tables A-1 and A-2 (on pages 19 and 22, respectively) provide detail on spending at agencies within each category and subcategory. The slower growth in budget outlays in 2010 follows an estimated 13 percent increase in 2009—14.5 percent for social regulatory agencies and 4.5 percent for economic regulatory agencies. In FY 2008, the most recent year for which the budget presents actual figures rather than estimates, the total Regulators’ Budget was $47.0 billion, an increase of 5.8 percent over 2007.
The Department of Homeland Security’s budget for administering regulations is the largest of any agency at over $26.6 billion in 2010. It has the largest share of the estimated Regulators’ Budget (47.7 percent) and is budgeted to receive the largest dollar increase in 2010 ($766 million). This reflects an increase in real terms (2.1 percent) and a significantly slower rate of growth than last year, which saw a real growth rate of 18.7 percent. Only Immigration and Customs Enforcement is budgeted for a decrease in 2010; the other regulatory agencies tracked within the Department of Homeland Security are all slated for budget increases in real terms. The post-September 11 budgets for the regulatory agencies that are now housed in the Department of Homeland Security are $18.7 billion greater than the outlays in 2000.
Spending to administer environmental regulations is the next largest subcategory after Homeland Security (14.1 percent of the total Regulators’ Budget) and also reflects the largest percentage change from FY 2009. Spending in this category, which includes the Environmental Protection Agency as well as several agencies within the Departments of Agriculture, Interior, and Defense, is budgeted to increase by 11.5 percent to $7.9 billion in 2010. FY 2009 outlays are estimated to be 3 percent more than in 2008.
The energy subcategory, which includes several Department of Energy agencies as well as the Nuclear Regulatory Commission, shows a spending increase of 3.1 percent. In contrast to spending trends of recent years, spending on petroleum regulation is slated to decrease by 21.5 percent and spending for the Department of Energy is projected to decrease by 15.9 percent. Only the Nuclear Regulatory Commission will see a budget increase ($50 million) in FY 2010. The energy subcategory has seen a real increase of 25.4 percent since 2007.
Also slated for a large increase from 2009 are the agencies in the workplace subcategory, which will see an increase of 9.7 percent in FY 2010. In 2009, that subcategory increased by 3.3 percent from 2008. The transportation category will decrease by 9.8 percent, mostly due to a 43.1 percent decrease to the Federal Railroad Administration’s budget.
Consumer safety and health agencies receive an additional $380 million overall, bringing the total to $7.3 billion. Within the subcategory, the Department of Justice’s Drug Enforcement Administration sees the only nominal decrease ($33 million). Almost all other programs see increases, including the Food Safety and Inspection Service, which is estimated to grow by 5.6 percent. Overall, the consumer safety and health subcategory sees a real increase of 4.6 percent over 2009.
Each of the subcategories in the economic regulation area is budgeted for increases in 2009. General business regulation will grow the fastest, with a real increase of 4 percent in 2010 after increasing by 0.2 percent in 2008. The budget request for this subcategory in 2010 is $3.7 billion. The budget for industry-specific regulation is projected to increase at a real rate of 1.7 percent in 2010 to reach $1.3 billion (following a 12.2 percent increase in 2009). As mentioned previously, after a 7.1 percent increase in 2009, spending on regulatory activity in the finance and banking subcategory is budgeted to grow 0.8 percent to reach $2.9 billion in 2010. The budget request for the Patent and Trademark Office’s regulatory activities is nearly $2 billion, a 1.2 percent real increase. After the Securities and Exchange Commission’s Regulators’ Budget declined in real terms in 2006 and 2007, spending has since increased 15.6 percent in real terms. In FY 2010, projected spending is $997 million, an increase of 6.9 percent over FY 2009.
Table 2 (on page 7) provides an overview of changes in personnel for each subcategory. Table A-3 (on page 25) provides staffing detail by agency. FY 2010 staffing levels are budgeted to increase 2.3 percent to reach 272,475 FTEs. Staffing at social regulatory agencies is slated to increase by 2.7 percent to 235,667 in 2009. Staff levels at economic regulatory agencies are projected to decrease by 0.2 percent to 36,808 FTEs.
The Department of Homeland Security has the largest regulatory staff, with a budget request of 145,279 FTEs in 2010. The 3.1 percent increase for DHS is mainly attributable to personnel growth in three agencies—Science and Technology, Customs and Border Protection, and Immigration and Customs Enforcement. Staffing at agencies devoted to consumer safety and health is budgeted at 37,607, an increase of 489 from 2009. Most of this increase can be attributed to the Food and Drug Administration, which grew from 11,064 FTEs in 2009 to 11,756 in 2010. The environment category sees an increase of 145 full-time staff in 2010, bringing the number of employees in the category to 26,435.
The transportation agencies are budgeted for a 2.8 percent increase (262 personnel) to 9,709 full-time personnel. Staffing at the workplace agencies also increases by 909 people, (or by 7.8 percent) to 12,571. The energy subcategory is budgeted for a personnel increase of 88 (2.2 percent).
Staffing in the economic regulation category is budgeted to decrease in 2010 by 0.2 percent, despite the 2.5 percent increase in spending in the category. Employees devoted to administering economic regulations are projected to decrease by 80 to reach 36,808 in 2010. The only increase in this category is for 139 employees in the industry-specific subcategory—a 2 percent increase over 2009. The bulk of this increase can be attributed to the Federal Energy Regulatory Commission, which will grow by 63 full-time staff in 2010. The 2010 budget requests a 1.2 percent staff decrease in the finance and banking subcategory (153 employees) and a 0.4 percent decrease in the general business subcategory (65 employees).
Conclusion
The FY 2010 Budget of the United States Government calls for expenditures on regulatory activities of $55.8 billion for the next fiscal year. This 2010 Regulators’ Budget request reflects both a nominal increase (4.2 percent) and an increase in real, inflation-adjusted terms (3.2 percent). Estimated 2009 outlays are 13 percent greater in real terms than actual FY 2008 expenditures. Staffing at federal regulatory agencies is budgeted to increase 2.3 percent in 2010 to 272,475 full-time equivalent employees. This is an increase of 6,175 employees over the 2009 level of 266,300.
Although the Regulators’ Budget’s real projected rate of growth for 2010 falls below the rate of growth for 2009 (4.2 percent versus 14.1 percent), it nevertheless stands in contrast to the objective expressed in the budget of holding the rate of growth for non-discretionary spending to 1 percent, well below the rate of inflation. Also, it should be noted that the FY 2009 budget request was that of President Bush, but the FY 2009 budget increase occurred under both President Bush and President Obama.
To conclude, regulatory expenditures and staffing are significantly larger in 2010 than they were in 2000. Driven by homeland security activities and now by the financial crisis, we anticipate that these numbers will keep increasing
Footnotes
[1] Veronique de Rugy is a senior fellow in the Regulatory Studies Program at the Mercatus Center at George Mason University. Melinda Warren is director of the Weidenbaum Center Forum at Washington University. This report is one in a series designed to enhance the understanding of the impact of federal regulation on society and does not represent an official position of either George Mason University or Washington University.
[2] See Veronique de Rugy and Melinda Warren, Growth in Regulation Slows: An Analysis of the U.S. Budget for Fiscal Years 2008 and 2009 (Arlington, VA and St. Louis, MO: Mercatus Center and Weidenbaum Center, August 2008).
[3] For the 2009 projected staffing increase, see Veronique de Rugy and Melinda Warren, “Regulatory Agency Spending Reaches New Height: An Analysis of the U.S. Budget for Fiscal Years 2008 and 2009,” Mercatus Center and Weidenbaum Center, August 2008.
[4] James Hamilton, Financial Regulation Reform: What to Expect in the 111th Congress, CCH, 2008.
[5] Office of Management and Budget, “Presidential Transmittal Letter: Budget FY 2010” (Washington, DC: May 7, 2009)/.
[6] Office of Management and Budget, “A New Era of Responsibility: Renewing America’s Promise,” http://www.whitehouse.gov/omb/assets/FY 2010_new_era/a_new_era_of_responsibility2.pdf.
[7] Office of Management and Budget, “Presidential Transmittal Letter: Budget FY 2010.”
Appendix
The Weidenbaum Center at Washington University has monitored trends in federal regulation for 31 years and has compiled 50 years of data on the administrative expenses of federal regulation. In 2002, the Mercatus Center at George Mason University joined the Weidenbaum Center to prepare this annual report on the regulatory administration and enforcement costs embodied in the annual Budget of the United States.
New data for this report were drawn from the Budget of the United States, Fiscal Year 2010 and supporting documents. This budget, also known as “the President’s Budget,” is presented to Congress approximately seven months prior to the beginning of each fiscal year (e.g., fiscal year 2010 begins October 1, 2009, and ends September 30, 2010). In this report, all references to specific years refer to fiscal years unless otherwise noted.
Budget figures for the 68 regulatory agencies contained in Table A-1 consist of outlays. The data on outlays provide a clear picture of the resources a regulatory agency directs to regulation in a given year. For example, some agencies are funded, partly or totally, by fees collected from businesses and individuals and these fee structures have changed over the years. The outlays reported here are gross of fees collected. These data are expressed in current dollars, rounded to the nearest million. Table A-2 provides comparable information in real terms (constant 2000 dollars). Because these numbers are rounded to the nearest million, the numbers do not necessarily add to totals.
The staffing figures shown in Table A-3 are derived from the full-time equivalent employment numbers for each agency. For example, two employees, each working half time, are counted as one full-time equivalent employee.
Tables A-4 and A-5 give data from 1960 to 2010 for annual outlays in current and constant dollars for major categories of regulation. Table A-6 provides staffing data for the same time period and categories. Detailed agency-by-agency data are available and can be obtained by contacting the Weidenbaum Center at Washington University or the Mercatus Center at George Mason University.
Agencies that primarily perform taxation, entitlement, procurement, subsidy, and credit functions are excluded from this report. Examples of these organizations are the Internal Revenue Service, the Social Security Administration, the Department of Defense, the Commodity Credit Corporation, and the Federal Housing Administration.
The notes to the appendix, which follow the appendix tables, give background on organizational changes since the Weidenbaum Center began tracking trends in regulatory budgets and staffing in 1977. Some agencies have been abolished while others have been created. Names of agencies have changed over time. These notes help the reader make sense of name and other changes that have occurred over the years.
Table A-1
Table A-2
Table A-3
Notes to Appendix Tables A-1, A-2, and A-3
1. The 1960–1970 data for the Animal and Plant Health Inspection Service are for the Agricultural Research Service.
2. Prior to the FY 1983 budget, data for the Food Safety and Inspection Service are for the Food Safety and Quality Service.
3. As of the FY 1996 budget, the Federal Grain Inspection Service and Packers and Stockyards Administration budgets were merged under the name Grain Inspection, Packers and Stockyards Administration.
4. The 1969 Food and Drug Administration data are for the Consumer Protection and Environmental Health Service, Food and Drug Control.
5. The Consumer Protection Programs of the Department of Housing and Urban Development have been listed under several sources. Data prior to 1975 are for the Office of Interstate Land Sales Registration; the data for 1980 are for the Office of Neighborhoods, Voluntary Associations and Consumer Protection. Staffing figures are not available for the Consumer Protection Programs or the Office of Lead Hazard Control and Healthy Homes. Staffing data are unavailable for both Consumer Protection Programs and the Office of Lead Hazard Control and Healthy Homes.
6. The Office of Federal Housing Enterprise Oversight was abolished on July 29, 2009, as required by the Housing and Economic Recovery Act of 2008. The Federal Housing Finance Agency will effectively absorb all remaining resources prior to the termination date.
7. Prior to the FY 1974 budget, data for the Drug Enforcement Administration are for the Bureau of Narcotics and Dangerous Drugs.
8. In FY 2004, the Bureau of Alcohol, Tobacco and Firearms was divided into two agencies—one within the Department of Treasury and one within the Department of Justice. These agencies—Treasury’s Alcohol and Tobacco Tax and Trade Bureau and Justice’s Bureau of Alcohol, Tobacco, Firearms and Explosives are both listed for consistency. Prior to the FY 1973 budget, data for the Bureau of Alcohol, Tobacco and Firearms were located under the Internal Revenue Service, Compliance.
9. The Chemical Safety and Hazard Investigation Board did not receive funding in 1996 or 1997. Its responsibilities were allocated to the Environmental Protection Agency and to the Occupational Safety and Health Administration for those years. In 1998, this agency began once again to receive funding.
10. On January 24, 2003, the law creating the United States Department of Homeland Security came into effect, creating the 15th executive department of the president’s cabinet. The Department analyzes threats, guards borders and airports, safeguard critical infrastructure, and coordinates the response of the United States government to future emergencies.
11. Port security activities required by the Area Maritime Security regulations (33 CFR part 103) were reported under the Department of Homeland Security’s Department Operations State and Local Program Urban Area Security Initiative. This program is only reported in the FY 2005 Budget of the United States Government.
12. Customs and Border Protection is a Department of Homeland Security agency, first appearing in the FY 2004 budget. Data from 1973 to 2001 are from the Department of Treasury, United States Customs Service. From 1960–1972, numbers are for the Department of Treasury, Bureau of Customs.
13. Numbers for the Immigration and Customs Enforcement in the Department of Homeland Security in 2001 and before are taken from the Department of Justice’s Immigration and Naturalization Services’ Immigration Enforcement (and Border Affairs).
14. Coast Guard was moved from the Department of Transportation to the Department of Homeland Security in the FY 2004 budget.
15. In the FY 2005 budget, research and development activities were moved from the Federal Highway Administration to the Department of Homeland Security’s Science and Technology Directorate.
16. On November 19, 2001, the Transportation Security Administration was created to “protect the nation’s transportation systems to ensure freedom of movement for people and commerce.” Its activities largely replace private-sector activities.
17. Reports prior to 2003 (Regulatory Budget Report 24) included transportation- related agencies in the consumer safety and health category.
18. The Federal Aviation Administration is listed as an independent agency in 1960.
19. In the FY 2005 budget, funding for research and development was moved from the Department of Transportation’s Federal Highway Administration to the Department of Homeland Security’s Science and Technology agency. As of the FY 2005 budget, no regulatory activity takes place in the Federal Highway Administration. This description is based on the press release “Ridge Sworn In Friday as Secretary of Homeland Security,” Remarks by the President at Swearing-In of Tom Ridge, Secretary of the Department of Homeland Security, January 24, 2003.
20. In the FY 2004 budget, funding of the Motor Carrier Safety portion of the Federal Motor Carrier Safety Administration was shifted to Motor Carrier Safety Grants.
21. Prior to the FY 2006 budget, data for the Pipeline and Hazardous Materials Safety Administration are for the Research and Special Programs Administration, Pipeline Safety.
22. The Surface Transportation Board was created on January 1, 1996, as a successor organization to the Interstate Commerce Commission.
23. Data for the Employment Standards Administration are for the Workplace Standards Administration from 1970–1972; data from 1963–1969 are under the Wage and Labor Standards Administration; and data from 1960–1962 are from the Bureau of Labor Standards, Women’s Bureau and Wage Hour Division.
24. Prior to the FY 1995 budget, the Office of the American Workplace was called the Labor Management Services Administration. Labor-management standards, enforcement, and related administrative functions were transferred to the Employment Standards Administration in 1996. Data from 1991–1993 are for Labor-Management Standards; data from 1970–1990 are for Labor-Management Services; and data from 1960–1969 are for Labor-Management Relations. The U.S. Department of Labor’s Office of the American Workplace (OAW) was disbanded due to lack of funding in July 1996.
25. In the FY 2004 budget, the Pension and Welfare Benefits Administration was renamed the Employee Benefits Security Administration. Prior to the fiscal year 1993 budget, data for the Pension and Welfare Benefits Administration were part of the Labor Management Services Administration.
26. The 1960–1972 data for the Mine Safety and Health Administration are for the Health and Safety Division of the Bureau of Mines, Department of the Interior; 1973–1978 data are for the Mining Enforcement and Safety Administration, Department of the Interior.
27. In 2000, the Forest & Rangeland Research division of the U.S. Forest Service at the Department of Agriculture began devoting resources to developing and implementing forest-planning regulations.
28. The 1960–1985 cost data for the Army Corps of Engineers were for the Protection of Navigation under the Operation and Maintenance category.
29. As of the FY 1997 budget, the Fish and Wildlife’s research and development budget was eliminated. Data for R&D after 1994 are listed under the U.S. Geological Survey. Before 1974, Fish and Wildlife and Parks were known as the Bureau of Sport Fisheries and Wildlife.
30. The 1990 costs for the Office of Surface Mining Reclamation and Enforcement reflect a major cut in federal support for the abandoned mine reclamation fund. The 1995 spending figures reflect a similar cut.
31. In the FY 1997 budget, the U.S. Geological Survey picked up the research and development formerly done at the Fish and Wildlife Service.
32. Construction grants are excluded from the calculation of the regulatory expenditure and staffing of the Environmental Protection Agency. Before 1970, EPA functions were scattered throughout the budget. Data for this report were taken from these Department of Health, Education and Welfare agencies: 1968– 1969, National Air Pollution Control Administration; 1968–1969, Environmental Health Service; 1960–1967, Public Health Service. Data from the Department of the Interior’s Federal Water Quality Administration were used for 1968–1969. 1962–1969 data from the Federal Radiation Council were also included.
33. These figures had included program and staffing costs for import/export authorizations under the Department of Energy’s Office of Fossil Energy’s Research and Development. After 2006, these activities were transferred to the Office of Electricity Delivery and Energy Reliability.
34. The Office of the Federal Inspector for the Alaska Natural Gas Pipeline was eliminated in 1997. It was no longer funded as of the FY 1987 budget. In the FY 2008 budget, the independent agency Office of the Federal Coordinator for Alaska Natural Gas Transportation Projects was added pursuant to the Alaska Natural Gas Pipeline Act of 2004. The first numbers from this agency appear in 2007.
35. In years prior to 2007, the Department of Energy’s Office of Energy Efficiency and Renewable Energy issued energy conservation standards. These data reflect obligations under the non-grant portion of “Building technology, State and community programs.” This agency was discontinued in the FY 2009 Budget.
36. Prior to FY 1974, the Atomic Energy Commission performed the activities of the Nuclear Regulatory Commission.
37. For the 1964 data for the Comptroller of the Currency, only an estimate was found.
38. Prior to the FY 1990 budget, data for the Office of Thrift Supervision was for the Federal Home Loan Bank Board.
39. The Federal Housing Finance Board (FHFB) regulated the 12 Federal Home Loan Banks that were created in 1932 to improve the supply of funds to local lenders that, in turn, finance loans for home mortgages. As required by the Housing and Economic Recovery Act of 2008, FHFB was abolished on July 29, 2009. The Federal Housing Finance Agency will effectively absorb all remaining resources prior to its termination date.
40. All data for the Federal Reserve System are presented on a calendar-year basis until the FY 2005 budget. Staffing figures are found in the Federal Reserve System’s Annual Report: Budget Review, various years. Numbers are estimated for the most recent fiscal years.
41. Data are from the Board of Governors of the Federal Reserve System’s Annual Report: Budget Review, various years. Numbers are estimated for the most recent fiscal years.
42. The 1960–1969 data for the National Credit Union Administration are for the Department of Health, Education and Welfare, Bureau of Federal Credit Unions.
43. The Agricultural Marketing Service was formerly the Consumer and Marketing Service. Starting with our 2003 report, these expenditures are included in the economic regulatory category.
44. As of the FY 2006 budget, the Economic Regulatory Administration is no longer funded. Starting with our 2003 report, these expenditures are included in the economic regulation category. Data for 1974 are for the Federal Energy Office; data for 1975 are for the Federal Energy Administration; data for 1977 are for the Regulation and Energy Information categories of Exploration, Development and Operations of Petroleum Reserves; data for 1981 are for the Department of Commerce, Emergency Preparedness and Energy Regulation and Department of Justice, Petroleum Regulatory Activities.
45. The Civil Aeronautics Board was abolished in 1984.
46. Prior to the FY 1976 budget, the Commodity Futures Trading Commission data are for the Commodity Exchange Authority, Department of Agriculture.
47. Prior to the FY 1980 budget, data for the Federal Energy Regulatory Commission are for the Federal Power Commission, the predecessor agency.
48. The Interstate Commerce Commission was abolished in 1996. 49. The Renegotiation Board was abolished in 1979. 50. The Cost Accounting Standards Board was abolished in 1980. 51. The Council on Wage and Price Stability was abolished in 1981.
52. The 1960–1971 data for the International Trade Administration are for International Activities—Export Control; the 1972–1976 data are for the Domestic and International Business Administration; the 1977–1979 data are for the Industry and Trade Administration.
53. Regulation of both imports and exports was once performed by the International Trade Administration. From 1988 until 2003, the regulation of exports was shown under the Export Administration of the Department of Commerce. In 2004, the Export Administration was renamed the Bureau of Industry and Security of the Department of Commerce.
54. Prior to the FY 1976 budget, the data for the International Trade Commission are for the Tariff Commission, the predecessor agency.

