- | Government Spending Government Spending
- | Data Visualizations Data Visualizations
- |
Some Measures of the Progressiveness of the U.S. Tax Code
Here are a few things to keep in mind amid the current chatter about reforming the tax code. These three charts are the first set of a series on the US federal income tax system. The first chart compares the average effective rate at which earners in different income quintiles are taxed by the federal government.
Here are a few things to keep in mind amid the current chatter about reforming the tax code.
These three charts are the first set of a series on the US federal income tax system. The first chart compares the average effective rate at which earners in different income quintiles are taxed by the federal government.
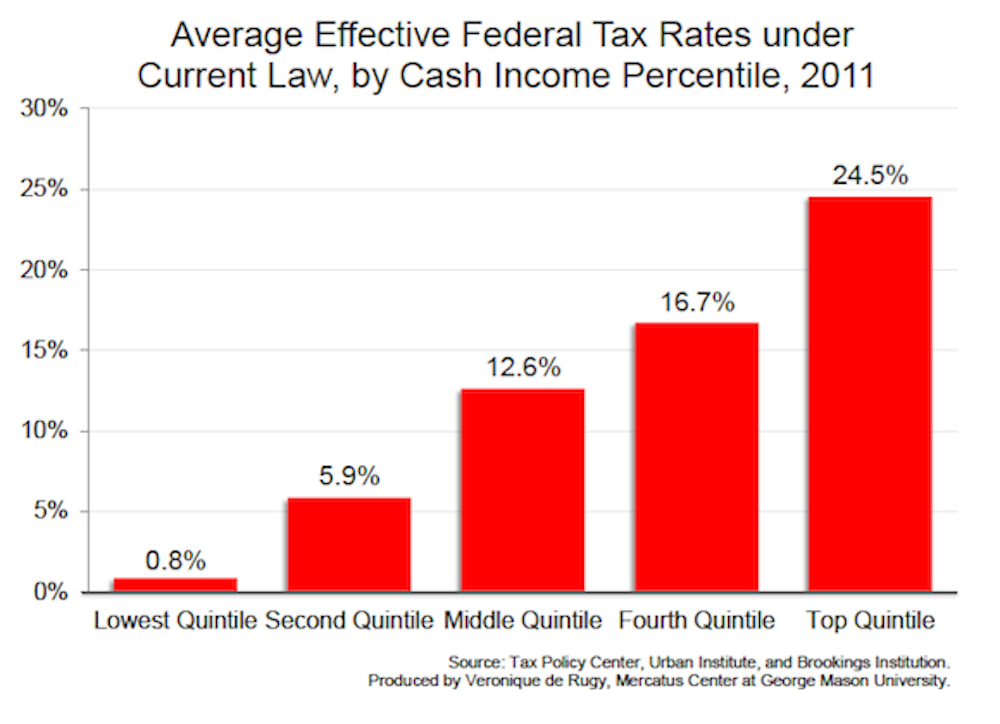
The effective federal income tax rate documents the level of taxation that individuals pay when all other tax offsets and deductions are applied. When certain groups have greater offsets than others, they face different effective tax rates, even if their official and marginal tax rates are identical.
This method of examining tax statistics makes the progressiveness of the US federal income tax system clear. Even when deductions and tax credits are taken into account, on average, wealthy Americans pay more in taxes than members of any other income group. Across the board, the rate of taxation increases with the level of earnings. At least by this measure, the federal tax system is progressive.
The second chart, below, shows the number of US millionaires (people and households earning $1 million or more, as reported by the IRS) and their relative contributions in paid income taxes.
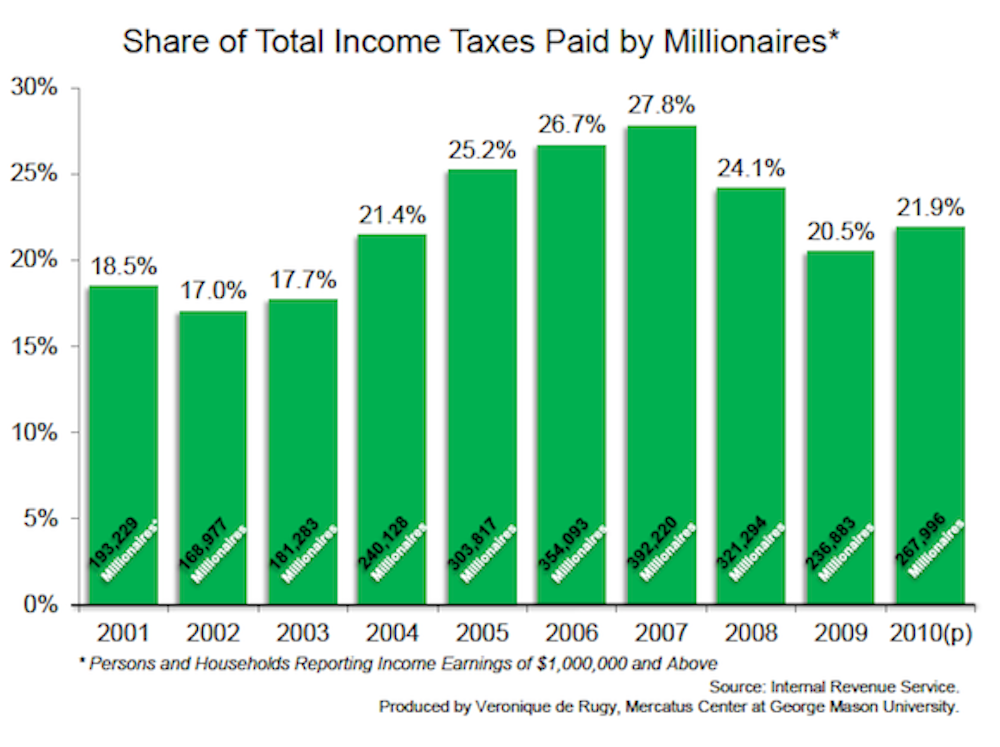
In 2010 alone, millionaires made up about 0.2 percent, or just fewer than 270,000 of the 142 million tax returns filed that year. Despite their small demographic imprint, the magnitude of their contribution in paid taxes is hard to overlook. Over the past ten years, millionaires have paid 17 to 28 percent of total income tax returns per year. By this measure also, the system is quite progressive.
The third chart looks at the most recent numbers of tax units who did not pay the federal income tax in 2013. According to the data, this tax season an estimated 39 percent of tax units will pay no federal income taxes.
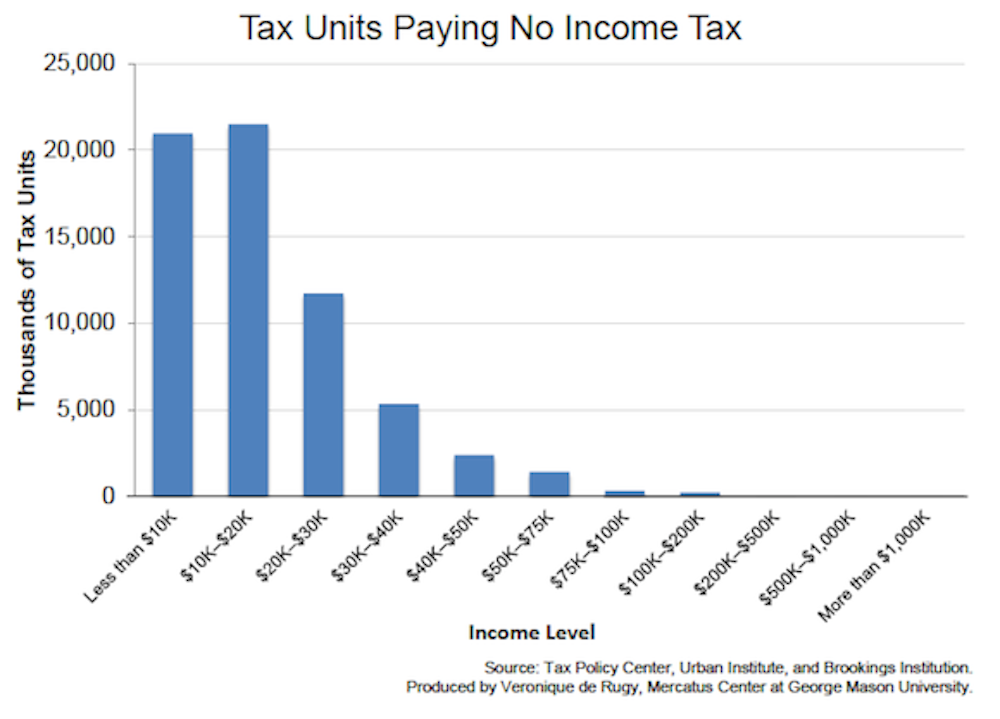
In 2013, federal income tax nonpayers were distributed throughout the earnings spectrum, with 32.2 percent of tax returns reporting less than $10,000 paying no income tax, and 33.0 percent of those making between $10,000 and $20,000 paying no income tax; the remaining 34.8 percent of Americans not paying income taxes were distributed throughout all income levels. As we can see on this chart, the vast majority of those not paying income taxes are low-income earners.

