- | Government Spending Government Spending
- | Data Visualizations Data Visualizations
- |
Trends in EITC Spending and Numbers of Beneficiaries
This week’s charts use data from the Congressional Budget Office and Internal Revenue Service to display average estimated federal tax burdens in 2010 and EITC trends from 1975 to 2010. The data show that, contrary to popular belief, federal tax burdens are quite low—and sometimes negative—for the lowest quintiles of the income distribution. Trends in EITC spending and beneficiaries over the past four decades shed more light on the program’s growing prominence.
The Earned Income Tax Credit (EITC), a refundable tax credit given to qualifying low-income working Americans, has been heralded as an effective anti-poverty tax incentive by commentators on both sides of the aisle since it was first introduced in 1975. Individuals or families whose incomes do not reach the minimum tax threshold receive a “negative tax,” or an income subsidy, the amount of which depends on the difference between their income and the threshold income. Supporters believe that this program delivers the security of a safety net without unduly inhibiting beneficiaries’ incentives to work.
This week’s charts use data from the Congressional Budget Office and Internal Revenue Service to display average estimated federal tax burdens in 2010 and EITC trends from 1975 to 2010. The data show that, contrary to popular belief, federal tax burdens are quite low—and sometimes negative—for the lowest quintiles of the income distribution. Trends in EITC spending and beneficiaries over the past four decades shed more light on the program’s growing prominence.

The first chart displays data from a CBO report on the distribution of federal taxes in 2010. The chart shows that the two lowest quintiles of the income distribution actually bear negative income tax burdens. The lowest quintile actually receives a benefit of 9.2 percent, while the second quintile receives a smaller benefit of 2.3 percent. This should be expected, since the EITC was designed to subsidize Americans whose incomes were too low to meet federal tax brackets. The third, fourth, and fifth brackets, on the other hand, receive no income or federal income tax subsidies on net and shoulder increased burdens as income increases.
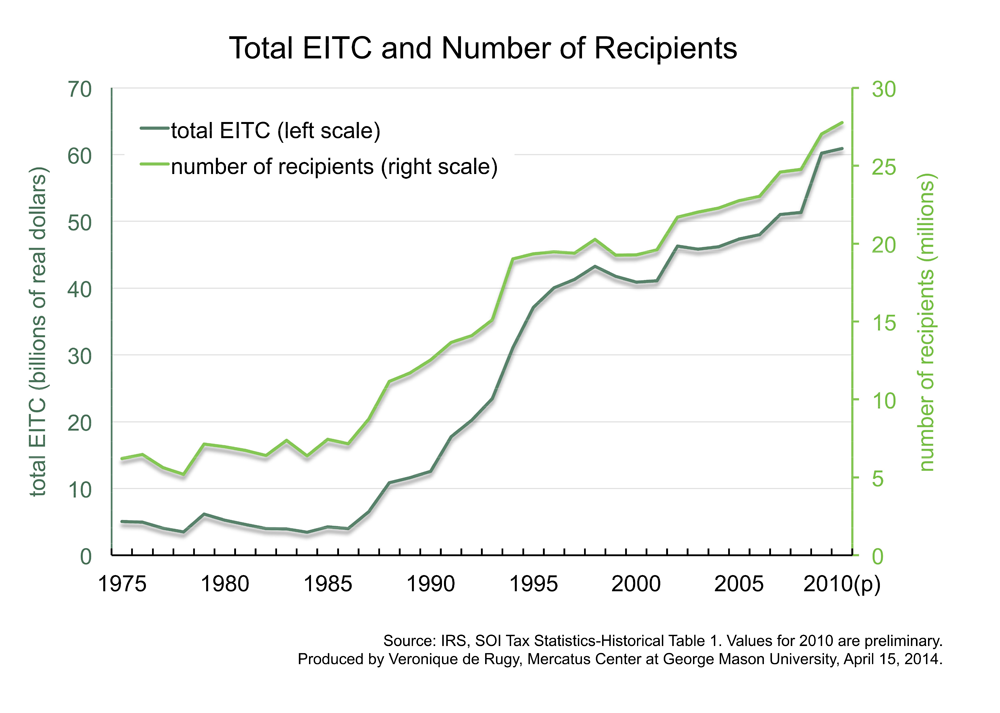
The second chart draws data from historical IRS tax statistics and displays the total amount of EITC spending and the total number of recipients from 1975 to 2010. The program has grown considerably since its inception in terms of both funding and recipients, ballooning from a relatively modest $5.07 billion in funding and 6.2 million recipients in 1975 to $60.9 billion in funding and 27.8 million recipients in 2010. While the EITC is intended to be an anti-poverty program, recipient and funding growth do not reflect underlying poverty trends that fluctuated and broadly improved during the same time. Factors such as changes in eligibility criteria, rather than the number of people living in poverty, have been driving the broad growth of the EITC program.
It is worth noting that the EITC program suffers from a high improper payment rate. As I noted with Jason Fichtner in February, the EITC made $12.6 billion in improper payments in 2012. This means that an alarming 22.7 percent of all EITC transfers during 2012 were made in error. The premise of using the tax code to engineer social outcomes is problematic in its own right, but the EITC’s history of high improper payment rates adds another cause for concern.

