- | Government Spending Government Spending
- | Data Visualizations Data Visualizations
- |
Debt and Deficit under Obama Administration

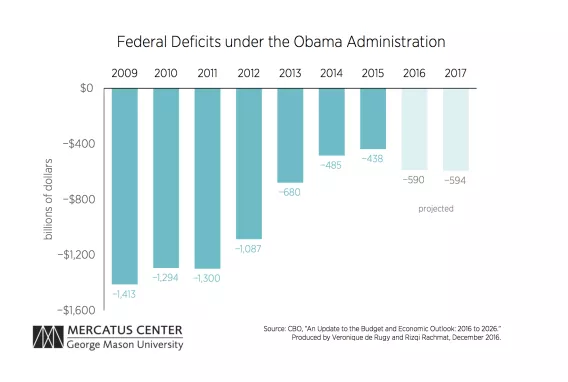
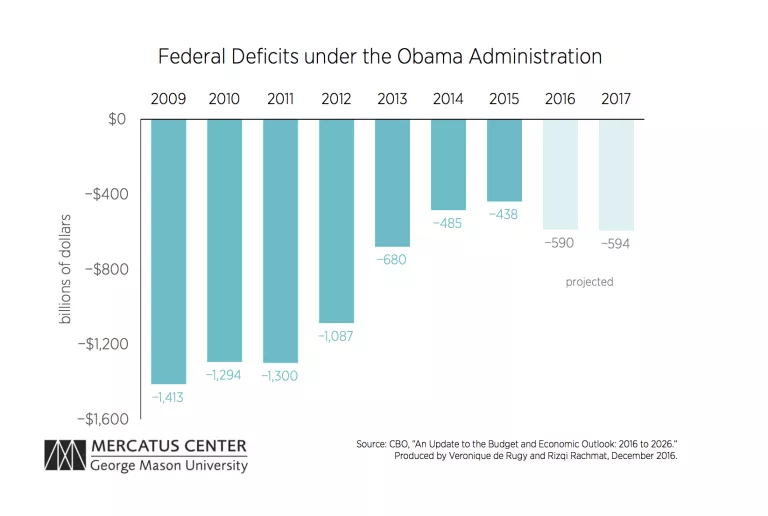
Annual budget deficits, which represent the federal government’s spending in excess of revenue, have begun to rise for the first time in seven years, dating back to 2009. President Obama inherited a deficit of $1.4 trillion when he took office at the end of the Great Recession. The first chart shows that deficits began to shrink as the economy slowly recovered. As of 2016 the shortfall has started growing again. The red ink increased $152 billion from last year, for a total projected deficit of $590 billion. This increase is also reflected in the fact that the deficit has resumed growing as a share of GDP for the first time since 2009.

The deficit is projected to increase only slightly in 2017 over 2016, but this projection might be optimistic. The Congressional Budget Office projects that unless the next administration gets spending under control, the trend of increasing deficits is likely to continue beyond 2017.
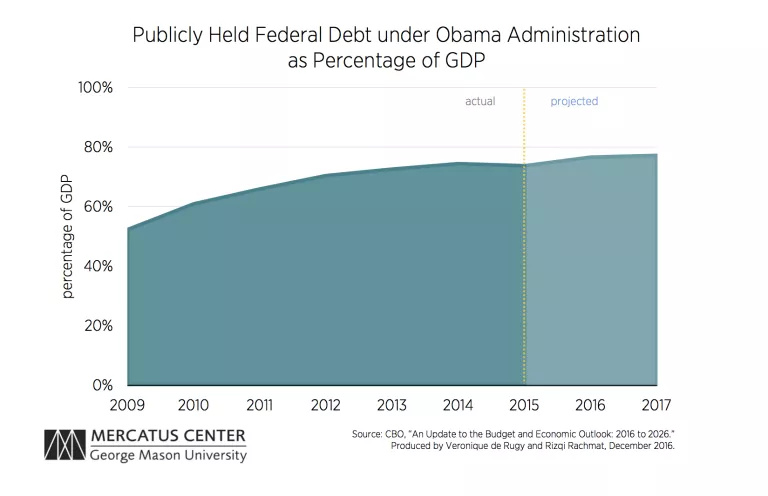
Debt held by the public is the cumulative amount of money that the government owes foreign and domestic investors. Large and rapidly rising debt is the direct result of the government living well above its means, as is the case in each year’s deficit. As the second chart demonstrates, publicly held debt almost doubled during President Obama’s eight years in office—it went from $7.5 trillion in 2009 to $14.1 trillion in 2016. The third chart illustrates the growth in debt as a share of the economy; debt held by the public rose from 52 percent of GDP to 77 percent of GDP over the same period.
The necessity of funding Medicare, Medicaid, the Affordable Care Act, and increasingly Social Security explains much of this growth in debt. Going forward, unless Congress and the administration undertake reforms that address these four key drivers of debt, the burden will continue to increase.


