- | Housing Housing
- | Policy Briefs Policy Briefs
- |
Land Use Regulations and Housing Affordability in Northern Virginia: A National Zoning Atlas Analysis
The National Zoning Atlas catalogs the local zoning rules that affect housing construction and affordability, showcasing potential areas for reform to meet the burgeoning housing needs of one of the nation's most prosperous regions. Here it examines the situation on the ground in Northern Virginia.
In recent years, policymakers have sought solutions to the housing shortages that plague their constituents with increasing urgency. Following decades of research and increasing activist pressure to reduce restrictions on homebuilding, these policymakers and scholars are looking critically at zoning regulations and local rules that shape the type and quantity of housing allowed to be built. Local policymakers largely determine their own zoning rules and permit-approval processes, and learning how land use is regulated across locales requires consulting zoning ordinances in tens of thousands of jurisdictions in the United States.
The lack of data on zoning regulations in various local jurisdictions where they are enacted has previously inhibited research on how these rules specifically affect housing construction and prices. The National Zoning Atlas (NZA) addresses the limited information on zoning rules across the country by compiling data on rules that constrain housing construction. Researchers at the NZA along with local teams across the country have been contributing to the atlas since 2020, with complete data for nearly 3,000 jurisdictions so far. Over the past year, our team added Northern Virginia to the NZA database, creating an in-depth picture of the current regulation of housing in one of the nation’s most prosperous regions.
In this policy brief, we explain the value of collecting data on zoning and the NZA methodology, we detail results from our analysis of regulations in Northern Virginia, and we provide context for our findings.
Measuring Zoning
The NZA project is an effort to provide granular data on land use regulations for each zone in the country where housing is allowed. After identifying the zoning districts within a jurisdiction, analysts log whether the districts are primarily residential, mixed with residential (namely, mixed use including residential), or nonresidential. Primarily residential zones allow housing and may permit limited other uses, such as schools, churches, and utilities. Mixed with residential zones generally allow housing and retail or office development. Nonresidential zones include industrial zones, which may have health and safety reasons for separation from housing, along with commercial zones where housing is not permitted, government zones, and land zoned for open space.
The atlas also provides detail on whether rules allow for one, two, three, or four or more housing units on a lot and how the size and shape of those buildings are restricted. This requires analysts to investigate questions such as these: Are two-family structures allowed to be built at all? Are they only allowed after a public hearing? How much land area do they require?
For zones that allow residential construction, the atlas includes data on the following regulations:
- Minimum lot size
- Front setback
- Side setback
- Rear setback
- Maximum lot coverage
- Minimum parking spaces
- Maximum stories
- Maximum height
- Maximum floor-to-area ratio
- Minimum unit size
For two-, three-, and four-plus-family housing, the following regulations are added:
- Maximum density
- Connection to utilities and transit (three- and four-plus-family only)
- Maximum bedrooms (three- and four-plus-family only)
- Maximum units per building (four-plus-family only)
The atlas also includes regulations on accessory dwelling units (ADUs), affordable housing, and planned residential developments. This rich data collection provides value for a range of audiences. Although not all atlas teams have made their complete datasets public, many have. The full dataset on zoning in Virginia will be available on the NZA website, with regional teams’ data being added as they are completed.[1] These data will provide researchers with the tools to estimate answers to questions such as, “What combination of rules makes duplex construction feasible?” or “To what extent do builders choose to provide off-street parking when zoning rules don’t require it?”
Currently, the Wharton Residential Land Use Regulatory Index (WRLURI),[2] developed in 2006 and updated in 2018, is one of the most widely used tools for comparing zoning regulations across the United States. The index is derived from survey data collected from a municipal employee or an elected official in US localities. The 2018 survey received partial or full responses in 2,844 localities.
WRLURI questions on land use policy fit into three buckets: (1) the permitting processes, (2) the rules limiting housing construction (i.e., minimum lot size requirements), and (3) the time the permitting process requires for different types of residential development. The WRLURI is the first tool to have provided researchers with the ability to compare the burden of zoning rules across jurisdictions and, together, the 2006 and 2018 data are the first measurement of the change in land use regulations across the country over time. Some studies use more detailed data on land use restrictions, but they tend to cover small geographical areas.[3]
Research using the WRLURI and other proxies for the burden of land use regulations across regions has shown that these rules have significant effects on housing markets and the broader economy. More restrictive land use regulations are associated with higher housing costs, more residential segregation, reduced income mobility, and even lower fertility rates.[4]
Although a growing body of research indicates that local zoning regulations have important effects on housing affordability and economic opportunity, researchers have not had precise data on local zoning rules across the country to study the effects of specific land use regulations. For example, the WRLURI provides data on whether a locality has any large lot zoning, but it lacks data on specific lot size requirements across zones.
The atlas also creates new opportunities for apples-to-apples comparisons of zoning in localities across the United States, potentially pointing policymakers to zoning reform opportunities that are well suited to their jurisdictions. Advocates can use the data to see specifically how reform proposals will change what can be built in their states or localities. In the following section, we describe the NZA findings in Northern Virginia for major categories of residential land use restrictions.
Residential Land Use Rules in Northern Virginia
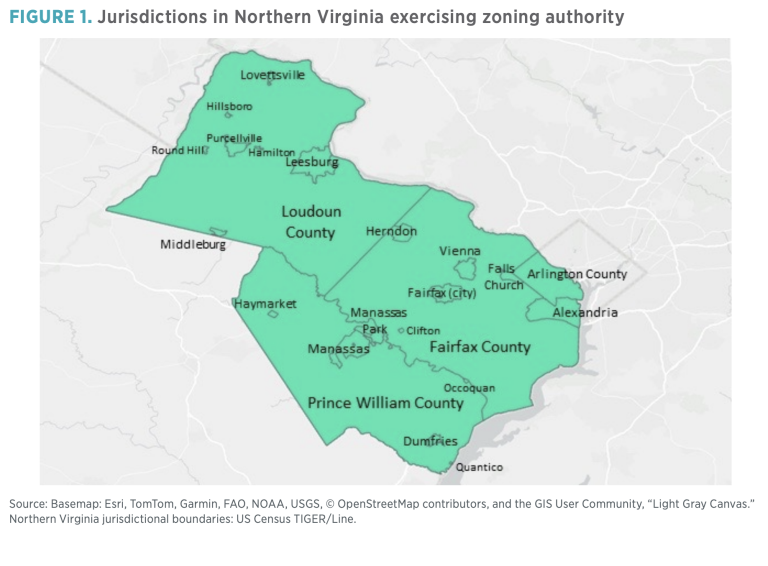
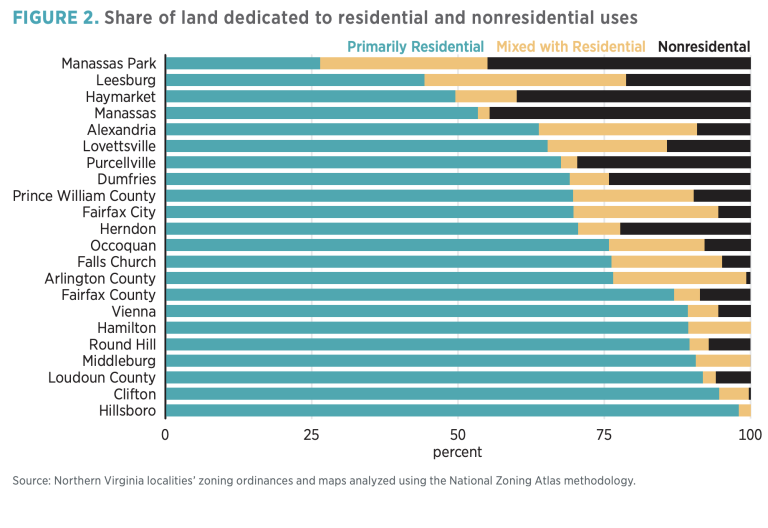
We have gathered zoning data for the 23 jurisdictions with a total of 534 zones in the Northern Virginia region (figure 1).[5] The region includes four counties (Arlington, Fairfax, Loudoun, and Prince William) and five independent cities (Alexandria, Falls Church, Fairfax City, Manassas, and Manassas Park). Across all of Northern Virginia, 84 percent of developable land is categorized as primarily residential under the NZA’s typology, encompassing residential districts and agricultural districts, which generally permit housing construction by right, but excluding most mixed-use districts (figure 2). The percentage of land zoned for primarily residential uses varies widely by locality, with Manassas Park being the lowest (26.4 percent) and Hillsboro being the highest (98.7 percent). Eight percent of the land in Northern Virginia is classified mixed with residential, with the remaining 8 percent classified as nonresidential.
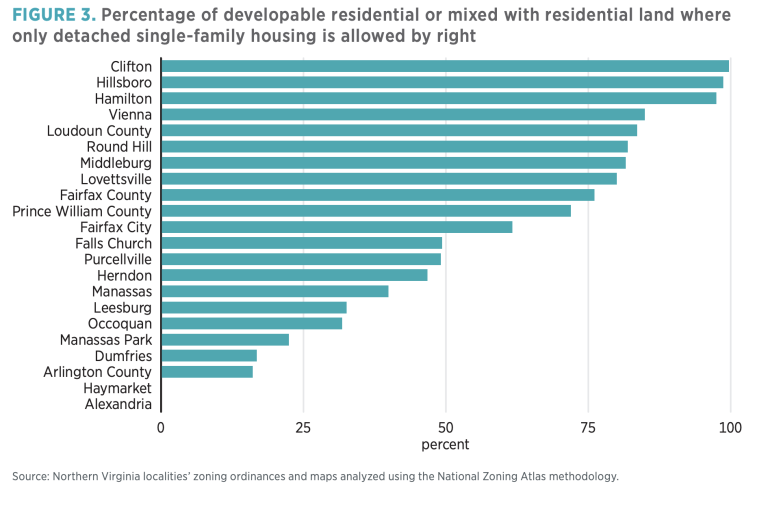
Single-family detached houses, the most expensive type of housing, are the only form of housing allowed in many primarily residential districts. In general, once a neighborhood is developed with detached single-family houses, zoning locks this development pattern in place, preventing the neighborhood from accommodating more people even if demand for housing and house prices increase markedly.
The share of land zoned for exclusively single-family houses similarly varies across jurisdictions (figure 3). The small towns of Clifton and Hillsboro are zoned almost entirely for single-family detached housing, whereas none of the primarily residential land in Arlington or Alexandria is restricted to single-family detached homes any longer, following 2023 reforms in both localities. Many commercial districts in Arlington, by contrast, still permit single-family detached homes by right while requiring a public hearing process for other residential uses; this is unaffected by the 2023 ordinance, which specifically revised the regulations in what had been single-family-home residential districts. However, the County Board approves extensive multifamily housing in these commercial zones through its special exemption process.
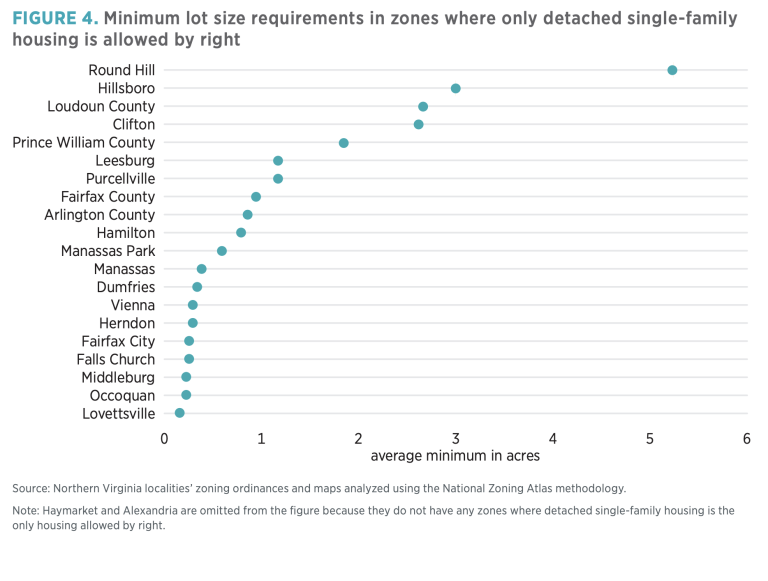
Although single-family zoning as a category rightly receives much focus from advocates and policymakers, the cost and density of single-family development varies widely across different single-family zones. Minimum lot size regulations determine how much land is required for each single-family house. The requirements for lot size in a given zone often vary depending on whether sewer and water infrastructure or other public services are available. To compare minimum lot size requirements across jurisdictions, we calculate each locality’s average minimum lot size required for land on which only detached single-family housing is allowed by right, assuming that any infrastructure needed for the smallest required lot size is already in place. Of the 20 jurisdictions in Northern Virginia, 13 have an average of less than one acre (figure 4). Lovettsville has the smallest average minimum lot size of 0.16 acres, whereas Round Hill has by far the largest with 5.24 acres. Nationally, the median new-construction house has a lot size of about 0.18 acres.[6]
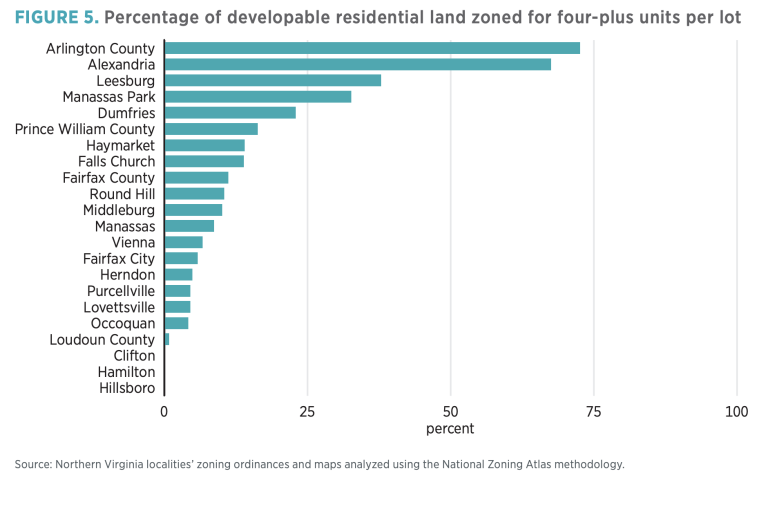
Land on which buildings with four or more units are allowed is just 9.5 percent of land overall (figure 5). In most Northern Virginia jurisdictions, multifamily construction is primarily confined to downtown or other commercial areas. This situation also varies significantly across jurisdictions, with 73 percent of Arlington allowing for these buildings but none of Clifton, Hamilton, or Hillsboro allowing for them.
Accessory dwelling units have emerged as one of the most popular tools for fighting the housing shortage. ADUs are secondary housing units on a piece of land zoned for another use. They are most commonly built on single-family lots as basement apartments, backyard cottages, or converted garages. ADUs offer a means to increase the number of housing units available for occupancy without dramatically changing the built environment (or in some cases, without changing the built environment at all). On 65 percent of the developable land in Northern Virginia, ADUs are allowed by right, including on 77 percent of land zoned exclusively for single-family detached housing (figure 6).

However, even where ADUs are allowed to be built, common regulations can dramatically limit their feasibility. These rules include limits on who can live in the ADU, such as age or employment restrictions; parking requirements for the ADU; or a requirement that in order to rent the ADU, the property owner must live in either the primary dwelling unit or the ADU.[7] No jurisdictions in Northern Virginia allow homeowners to build ADUs without at least one of these restrictions, severely limiting their feasibility.
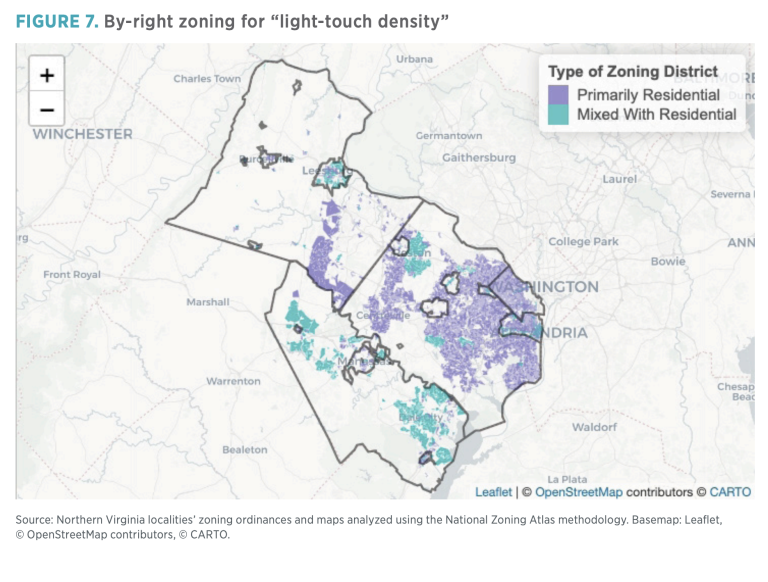
In addition to enabling ADUs to be constructed, altering zoning to permit moderately more primary housing units to be built in single-family neighborhoods is another popular pathway for zoning reform. This approach is referred to as “light-touch density,” “missing middle housing,” or “gentle density.”[8] These reforms include changes to single-family zones to allow duplexes, triplexes, or fourplexes. Reforms can also include allowing denser development of single-family homes, such as by decreasing minimum lot sizes or legalizing townhouses. We measured the amount of land in Northern Virginia that meets the following criteria: zoning allows for two- or three-family housing or allows for single-family housing, including townhouses, on lots less than 2,500 square feet. The resulting area is 20.8 percent of the total land (figure 7).
The following section describes Northern Virginia’s housing market under these land use rules and compares Northern Virginia to peer regions.
Northern Virginia’s Land Use Restrictions in Context
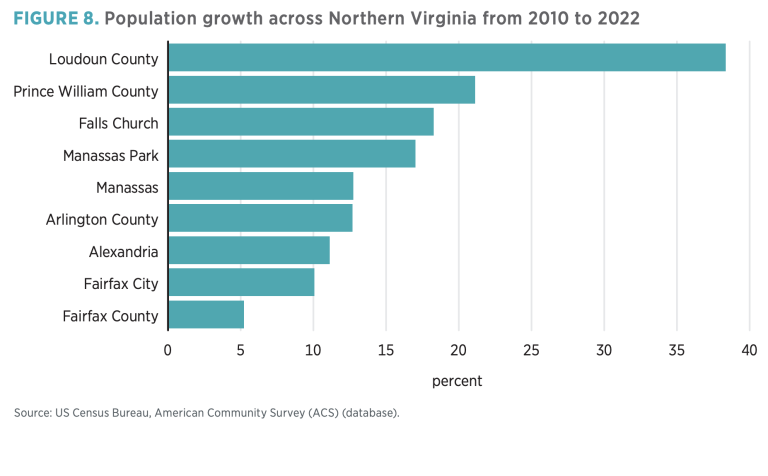
Although land use regulations across Northern Virginia limit housing construction and drive up its costs, the commonwealth’s population is growing faster than the United States’ as a whole. Relative to some high-demand parts of the country, Virginia’s regulatory burden is lighter. The slowestgrowing jurisdiction (Fairfax County) grew 5.23 percent from 2010 to 2022, the median jurisdiction (Manassas) grew 12.75 percent, and the fastest-growing jurisdiction (Loudoun County) grew 38.35 percent (figure 8). As a point of comparison, California grew only 4.6 percent over this time and has lost population in the most recent years.
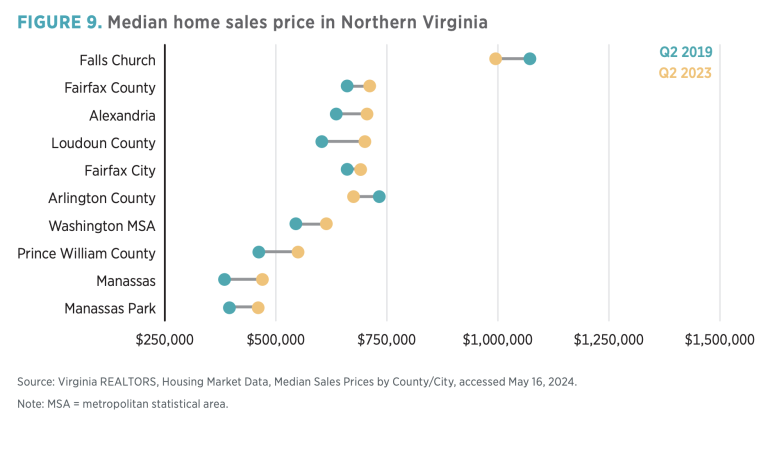
In spite of Northern Virginia’s relative accommodation of population growth, house prices have increased as well (figure 9). Between 2019 and 2023, the greater Washington, DC, area saw an increase of roughly 13 percent after adjusting for inflation. Out of nine jurisdictions, only two, Arlington County and Falls Church, saw a decline in the median sale price during this period.
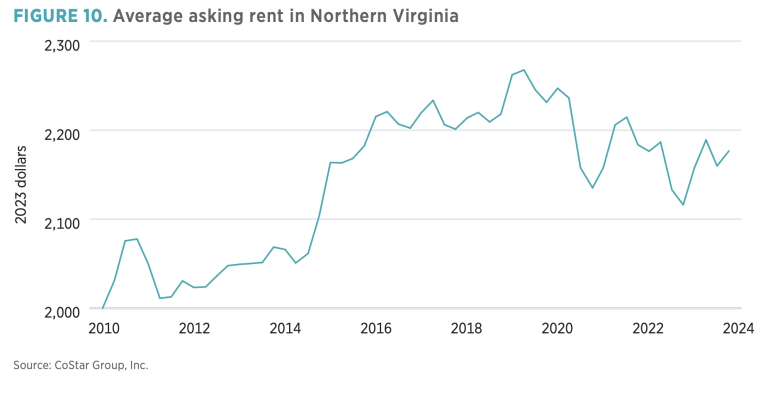
Since 2010, average rents in Northern Virginia have climbed almost $200 a month after adjusting for inflation (figure 10); the vacancy rate has been consistently lower than the national rate, with an exception for the depths of the pandemic (figure 11).

Across the country, local governments use similar types of rules to restrict housing construction, but the extent of these restrictions varies widely. The substantial affordability challenges caused by land use regulations in Northern Virginia and the DC metropolitan area notwithstanding, this region is more open to housing construction than many other metropolitan coastal regions are. For example, during the construction of rail transit in Arlington, the county upzoned nearby areas, allowing for more multifamily construction.[9] Fairfax County adopted a transit-oriented development plan in Tysons, allowing a large increase in multifamily construction. Loudoun County is the region’s fastest-growing municipality owing in large part to greenfield construction, but its growth includes substantial townhouse and multifamily construction along with detached single-family construction.
In contrast, the suburbs of other high-income coastal regions, such as San Francisco, Boston, Los Angeles, and New York City, have allowed much less multifamily construction. Some of Boston’s suburbs lie in New Hampshire, a state with a completed zoning atlas. Some 93 percent of New Hampshire’s developable land is restricted to exclusively detached single-family zoning, compared with 71 percent in Northern Virginia. In New Hampshire, single-family houses on lots less than one acre are allowed on only 15 percent of developable land, whereas 69 percent of Northern Virginia’s developable land allows for plausible single-family construction on less than an acre of land.
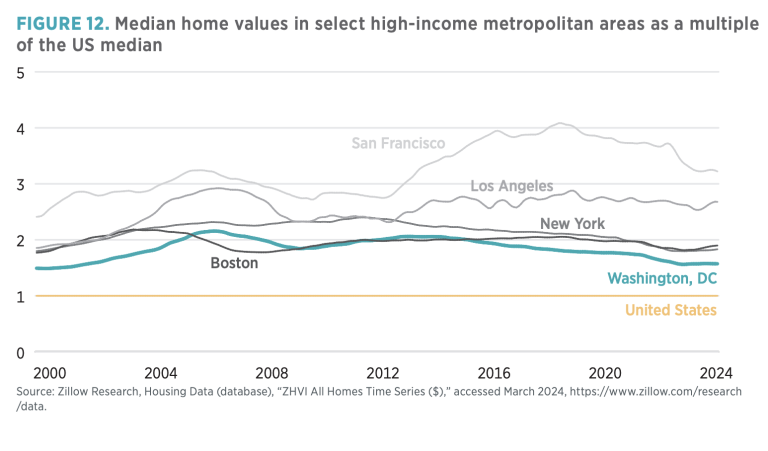
The price of housing in the Northern Virginia area is above the national average, but the DC metropolitan area is far less expensive than comparable regions that permit less housing construction (figure 12). Since the turn of the millennium, while DC’s prices have been between 47 percent and 115 percent higher than national prices, Boston’s have been 77 percent to 118 percent higher; New York’s, 80 percent to 140 percent higher; Los Angeles’s, 85 percent to 192 percent higher; and San Francisco’s, 141 percent to 309 percent higher. As the atlas data show, policymakers in Northern Virginia have ample opportunities to reduce the barriers of local land use regulations. The problems caused by housing supply constraints, however, are far worse in more heavily regulated peer regions.
Conclusion
The NZA data provide an important new tool for advocates of zoning reform and open up new opportunities for researchers to study the effects of specific zoning rules and combinations of rules. We find that in spite of high demand to live in Northern Virginia, a majority of the land cannot be developed with more than one detached housing unit, and requirements for large lots are pervasive. Nonetheless, in many peer regions of the country, barriers to housing construction are higher, corresponding with more severe affordability problems. Northern Virginia already has a successful blueprint for reforming exclusionary zoning with examples such as Arlington’s transit corridors. The zoning atlas provides details on the rules facilitating construction across the region, pointing to reforms that could address the housing shortage in the large parts of the region where development is currently locked out.
Acknowledgments
In addition to the authors, Milica Manojlovic, Micah Perry, Rishab Sardana, and Arthur Wright gathered data for the Northern Virginia Zoning Atlas. Thank you to Eric Mai for sharing the code used to create these charts and maps and to him and Housing Forward Virginia for creating an interactive map of the Northern Virginia data available at https://housingforwardva.org/focused-initiatives/zoning/atlas/. Thank you to Yonah Freemark for sharing the data on zoning in the DC region that he collected for research at the Urban Institute. These data formed the basis of our geospatial data collection and served as a useful quality check on our zoning code analysis.
About the Authors
Eli Kahn is a research assistant at the Mercatus Center’s Urbanity project, supporting the center’s scholarship in housing supply. He holds a master’s degree in public policy from the University of California, Berkeley, where he studied housing, transportation, and environmental policy.
Andrew Crouch is a second-year MA student in economics at George Mason University. He earned a bachelor’s degree in economics from George Mason University, and his research interests include urban economics and housing policy.
Emily Hamilton is a research fellow at the Mercatus Center at George Mason University. Her research focuses on urban economics and land use policy. Hamilton has testified before several state legislatures as well as the US House of Representatives. Hamilton serves on the advisory boards of Up for Growth and Cityscape, a journal published by the Department of Housing and Urban Development.
Notes
- National Zoning Atlas, “Virginia Zoning Atlas,” accessed May 13, 2024, https://www.zoningatlas.org/virginia.
- Joseph Gyourko et al., “The Local Residential Land Use Regulatory Environment across U.S. Housing Markets: Evidence from a New Wharton Index” (NBER Working Paper 26573, National Bureau of Economic Research, Cambridge, MA, December 2019).
- For examples, see Edward L. Glaeser et al., “Regulation and the Rise of Housing Prices in Greater Boston” (Rappaport Institute for Greater Boston at Harvard University and Pioneer Institute for Public Policy Research, Cambridge, MA, January 5, 2006); Robert C. Ellickson, “Zoning and the Cost of Housing: Evidence from Silicon Valley, Greater New Haven, and Greater Austin” (Yale Law School, New Haven, CT, January 13, 2020).
- John Myers et al., “The Housing Theory of Everything,” Works in Progress 5 (2021).
- The Virginia Zoning Atlas is broken up into regions determined by the commonwealth’s Regional Cooperation Act, which created associations of local governments. Quantico does not have a publicly available zoning map. We have collected the atlas data on its land use regulations by zone, but we are not able to provide statistics here for its regulations by land area.
- US Census Bureau, Characteristics of New Housing (database), “Lot Size, Single Family Completed,” June 1, 2023, https://www.census.gov/construction/chars/current.html.
- Emily Hamilton and Abigail Houseal, “Legalizing Accessory Dwelling Units at the State Level: A New Hampshire Case Study” (Mercatus Policy Brief, Mercatus Center at George Mason University, Arlington, VA, March 30, 2023).
- Alex Baca, Patrick McAnaney, and Jenny Schuetz, “‘Gentle’ Density Can Save Our Neighborhoods,” Brookings Institution, December 4, 2019.
- Emily Hamilton, “How DC Densified,” Works in Progress 11 (2023).

