The economic crisis triggered by the COVID-19 epidemic has led to historic job losses across a range of industries. Nonfarm payroll employment as reported by the Bureau of Labor Statistics (BLS) declined by 20.5 million in April, the largest drop since the start of the series in 1939. Employment fell in all major industries, but losses were particularly dramatic in leisure and hospitality (7.7 million, or 47 percent). These numbers indicate the size of the shock and the reduction in output that will follow from it.
As production and consumption fall, so do some types of tax revenue. This is particularly problematic for state and local governments, as they generally face balanced-budget requirements the federal government does not. In addition, many local governments are constrained in what types of taxation they may use owing to limitations imposed on them by state governments. Revenue shortfalls at the state and local level can therefore have significant consequences for the almost 20 million workers who are employed by state and local governments.
Different states, cities, counties, and other local government units rely on widely varying sources of revenue. For example, some states have no sales tax; others have no income tax. In addition, given categories of workers (e.g., teachers or healthcare workers) are employed by different units of government in different states (state vs. county, municipality vs. special district). In this brief we illustrate how funding for four large categories of state and local government employees varies from state to state. The impact of COVID on state and local government functions will vary widely across states owing to the organization of the states’ revenue structures. For example, one would expect the current crisis to reduce sales and income tax revenue, with a smaller impact on other sources of revenue such as property taxes and fees.
Crafting the correct immediate response involves understanding these nuances. Understanding which government functions are most sensitive to the COVID shock is crucial for targeting federal monies. We therefore focus in particular on the extent to which income and sales taxes pay for the salaries and benefits of different categories of workers. The public-sector workers we focus on are healthcare and hospital workers; police and corrections officers; teachers; and utility workers. These sensitivities are also important as we think about fine-tuning our system of fiscal federalism, which may currently provide too little revenue source flexibility for local authorities. In any case, before revealing the extent to which the pay of the workers we focus on relies on income and sales taxes across the states, let us provide a brief note on our calculations.
Methodology
The notion behind our calculations here is imperfect fungibility of revenue across governmental units. Revenue lost by a county is likely to have a larger impact on those employed directly by the county than on those employed by municipalities. This is commonly referred to as the “flypaper effect,” the phenomenon that shocks are sticky and have a disproportionate impact where they hit.
Conceptually, we capture this notion as follows: For each unit of government, be it a state, county, city, school district, or whatever other local governments different states have, we calculate where its revenue comes from. In particular, we calculate the shares of revenue from personal income and sales taxes. For each occupational category, we then calculate which share of full-time equivalent (FTE) workers in that state is employed by each different unit of government. Finally, we multiply these shares and sum them across units of government to arrive at the share of funding for each occupational category that comes from each revenue stream. The implicit assumption of a direct link between revenue losses and employment reductions strikes us as reasonable given the strong correlation between changes in state and local tax receipts and changes in state and local FTE employment. Based on data from 1954 to 2018, we found a correlation of 0.4994.
Our calculations are based on the Census Bureau’s Survey of State and Local Government Finance, combined with the Census Bureau’s Survey of Public Employment and Payroll. We use data from 2017, as that is the latest available year in which the universe of governments was surveyed, but in normal times the general patterns do not vary much across years. We combine these surveys at the unit-of-government (state, county, municipality, special district, etc.) level.
For each unit of government, we define the share of non–insurance trust revenue coming from personal income taxes and from sales taxes (including general sales, alcohol and tobacco sales, and other sales taxes). For local governments, we also calculate the share of revenue coming from the state government. We then allocate the intergovernmental share in proportion to the state’s own (nontrust) revenue sources, including income and sales taxes. This way we arrive at a sum of shares from sales and income taxes from both direct and indirect reliance on these taxes.
Finally, we average these individual government shares of revenue from income and sales taxes, weighting by FTE employment, to the state level for each of the four categories of workers to which we now turn. We should note that sales and income taxes are not the only revenue sources likely to fall during this crisis. Several states, including Alaska, depend heavily on the oil and gas industry, either via production taxes, royalties, or severance taxes.
Healthcare and Hospital Workers
The first category of workers we look at, healthcare and hospital workers, consists of a little over 1.4 million FTE workers. These employees work directly for state, county, and city governments (e.g., public health and inspection roles, visiting nurses, public hospitals) and for special districts like the South Broward Hospital District (Memorial Health Care System) in Florida or the Charlotte-Mecklenburg Hospital Authority (Atrium Health) in North Carolina.
An average of 9.2 percent of their funding comes from personal income taxes and a little over 13.5 percent from sales taxes. The geographic differences across the states in figures 1a and 1b are in part explained by the absence of an income tax in a number of states, a recurring detail of the maps we will see. To the extent that the nature of the COVID-19 crisis makes it particularly detrimental to the collection of sales taxes, these states will face greater revenue shortfalls.
Nevada, with its heavy reliance on sales taxes generated by the Las Vegas tourism and hospitality industry, and Hawaii, with its similar dependence, are perhaps the best examples of this phenomenon. Healthcare and hospital employees in these states work for governments that receive nearly 30 percent of their revenue from sales taxes. By contrast, most public health and hospital employees in Wyoming and South Carolina work for agencies that receive more than half of their revenue from payments for healthcare services.

Police and Corrections Officers
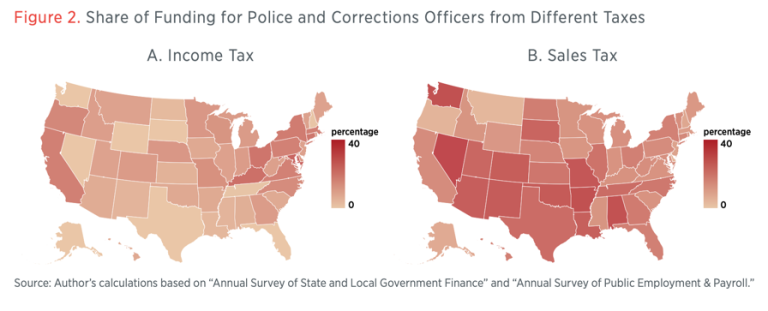
Employees of police and corrections departments are the largest group of workers we analyze here, at a little over 1.6 million FTEs. Their salaries are funded more through sales taxes (14.9 percent on average) and less through income taxes (8.0 percent) than those of healthcare and hospital workers. It is apparent from figure 2a that income taxes are particularly important revenue for police and corrections officers on the coasts and in the Midwest, while figure 2b shows that sales taxes are dominant in the South and the Plains states.
Alaska has the lowest percentage of funding for police and corrections officers stemming from either of these taxes. Instead, it relies heavily on revenue from sources like natural resources and “miscellaneous” general revenue.
Teachers
Funding streams for teachers are more reliant on property taxes than those for other occupations we discuss here: nationwide they account for about a third on average. This translates, specifically, into a lesser reliance on sales tax revenue than was the case for healthcare and law enforcement workers, as figure 3a shows.
There are a few notable exceptions to this rule (see figure 3b). While outside of Louisiana 96 percent or more of independent school districts do not rely on sales taxes at all, in Louisiana, virtually every independent school district collects sales taxes. Hawaii’s teachers also work for a governmental unit that receives more than 30 percent of their funding from sales taxes. This is because Hawaii has the only statewide public-school system in the country, and the teachers are state employees. Other states with a relatively high sales tax share, such as Nevada, arrive at this dependence indirectly, via intergovernmental aid.

Utility Workers
Utility workers (in waste, water supply, sewer, electricity, and gas) are the true outlier among the four categories of workers we have looked at. Income taxes are barely relevant for them (see figure 4a), with Maryland and Ohio—with their local income taxes—as dramatic exceptions to the rule. This is consistent with a recent analysis that found these states, along with Kentucky, as the most dependent on local income taxes as a source of revenue.
Correspondingly, sales taxes account for a larger share of public sector utility workers in other states (see figure 4b). States that do not rely heavily on either of these sources tend to rely on utility service revenue (as in Nebraska), on property taxes (New Hampshire), or on both (Maine and Vermont).

Conclusion
State and local government employment fell by almost a million workers in April, a decline that largely resulted from school closures. As states and localities start adjusting to new budgetary realities, in the absence of federal relief more layoffs will likely follow. This will be the case especially among workers whose salaries are largely funded through income and sales taxes, and especially those employed in the majority of states without ample rainy day funds. While the current crisis may serve as an opportunity to draw attention to problems related to the long-term fiscal sustainability of public pension funds, reforms on that front will do little to stave off these job losses. The patterns shown here should help inform policymakers at the federal level as they consider how much and what kind of relief to provide and where to target these dollars.
The desirability of such relief should also inform more long-term discussions about our system of fiscal federalism. While there are good reasons for the restrictions imposed on deficit financing at the state and local level, the systematic use of intergovernmental transfers to plug budgetary holes during downturns undermines them. In fact, it risks triggering similar types of moral hazard as implicit bailout guarantees of state governments who struggle to meet their debt obligations do, but without the price signals that might be generated in state bond markets. Previous research by us suggests that a move toward more flexibility for local (and perhaps state) governments could be beneficial at the margin. In that paper, we show that cities with home rule, which provides them with more autonomy in raising revenue, face less revenue volatility and stronger bond ratings. When hit by a negative shock to sales taxes, these cities increase the revenue they collect from property taxes and other revenue sources. Our current corner solution—where states and localities face balanced-budget requirements and the federal government is entirely responsible for keeping fiscal policy from becoming overly procyclical—may be too extreme.
Finally, different sources of revenue respond very differently to different shocks. Therefore, economists often weigh the tradeoff between more volatile but more progressive income taxes and more stable but more regressive sales taxes. What the COVID-19 crisis may well show us is that this tradeoff is not so straightforward: that the unpredictability of how future shocks will hit should make us place more value on the diversification of revenue streams.
About the Authors
Daniel Shoag is an associate professor at the Weatherhead School of Management at Case Western Reserve University. He was formerly an associate professor of public policy at Harvard Kennedy School and an affiliate of the Taubman Center for State and Local Government. His research focuses on state and local government finance, worker signaling and the hiring process, and regional and urban economics. Shoag’s research has been published in major academic journals and has been featured in, among other outlets, the New York Times, Bloomberg, the Washington Post, and the Wall Street Journal.
Stan Veuger is a resident scholar at the American Enterprise Institute (AEI), where he specializes in political economy and public finance. He is also the editor of AEI Economic Perspectives. He is a fellow at the IE School of Global and Public Affairs in Madrid and at Tilburg University in the Netherlands. His research has been published in leading academic and professional journals, including the Journal of Monetary Economics, the Quarterly Journal of Economics, and the Review of Economics and Statistics. He is the editor, with Michael Strain, of Economic Freedom and Human Flourishing: Perspectives from Political Philosophy (AEI Press, 2016).

